My eyes hurt.
Well life is slowly but surely becoming relatively normal again after the worst Xmas ever. The combination of a foot operation the week before Xmas, my garage (which was my AT store) being burgled the day before the foot op and no skiing was pretty depressing. Thankfully the New Year has started more positively and I have settled into the design office at Ramboll in the New Forest quite nicely.
Just as Rich Phillips had warned me, it is a bit quiet but everyone is very nice and extremely helpful. The pace of life is much more sedate and for once I am not the biggest geek in the room! Luckily I sit near a guy who is also a very keen mountain biker and behind a girl who has just finished her geology degree and is keen to explain principles to me. Rich has paved the way in what they expect and what sort of things we need to cover so thanks Rich if you ever read this!
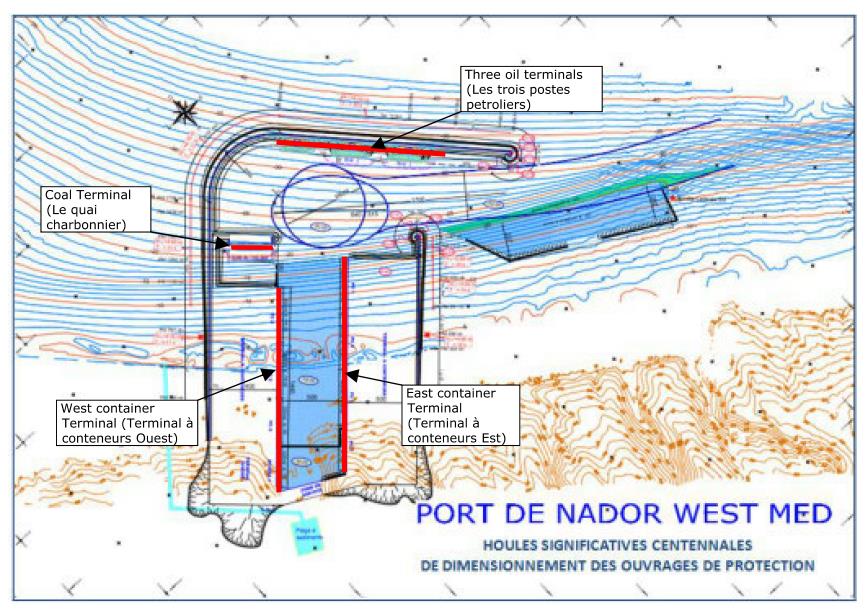
My first task has been of mammoth proportions. Ramboll have been tasked to come up with a design for a breakwater for a port out in Morocco. Initially I thought great, you just design the core, protective rubble layer, do a bit of maths for settlement, wave and boat impact loads and off you go-WRONG! This breakwater is 3km long in 35m of water and a purely rubble breakwater would have needed to be 450m wide! To add to the problems it would be founded on around 8-10m of soft silt which has the compressibility and strength of a soggy bathroom sponge. Ramboll changed the design to be a rubble mound with a concrete caisson (30m wide and 35m tall) to bring the structure above sea level.
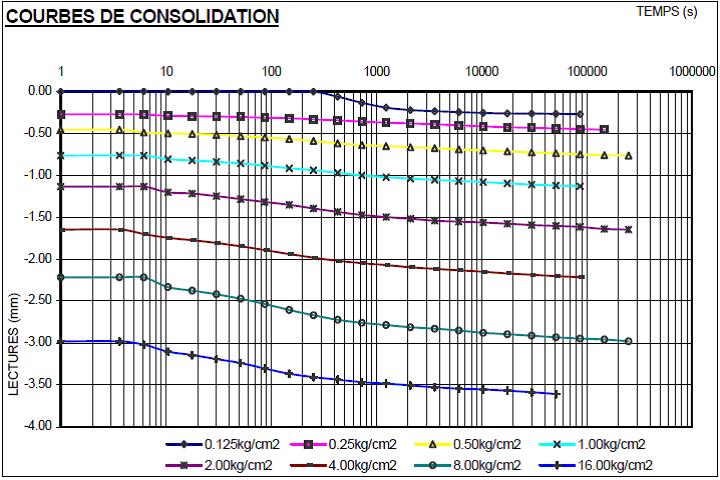
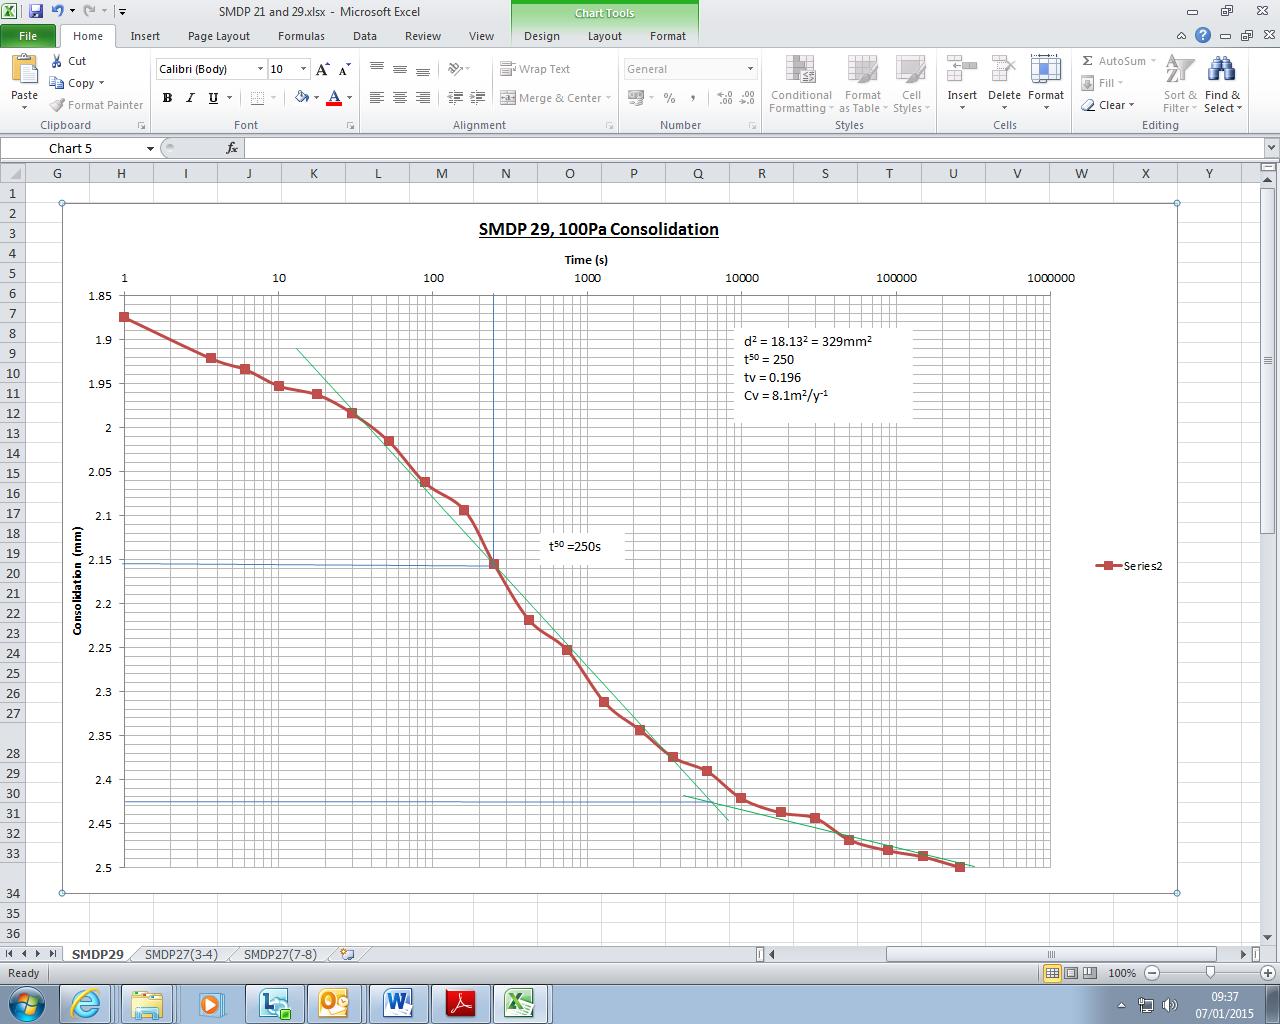
My initial task was to go through the 1D oedometer tests (which were all in French) and re-plot them on bigger axes to be able to establish the primary and secondary compression lines of best fit. This meant getting my head back into the books to understand the oedometer test and the theory of consolidation. I then had to calculation the coefficient of consolidation (cv) using the Casagrande logarithm of time fitting method. This involved plotting lots of points, fitting lines, measuring time values and calculating cv on a spreadsheet. The work was quite time consuming and monotonous and it hurt my eyes but it was a good opportunity to fully understand some theory.
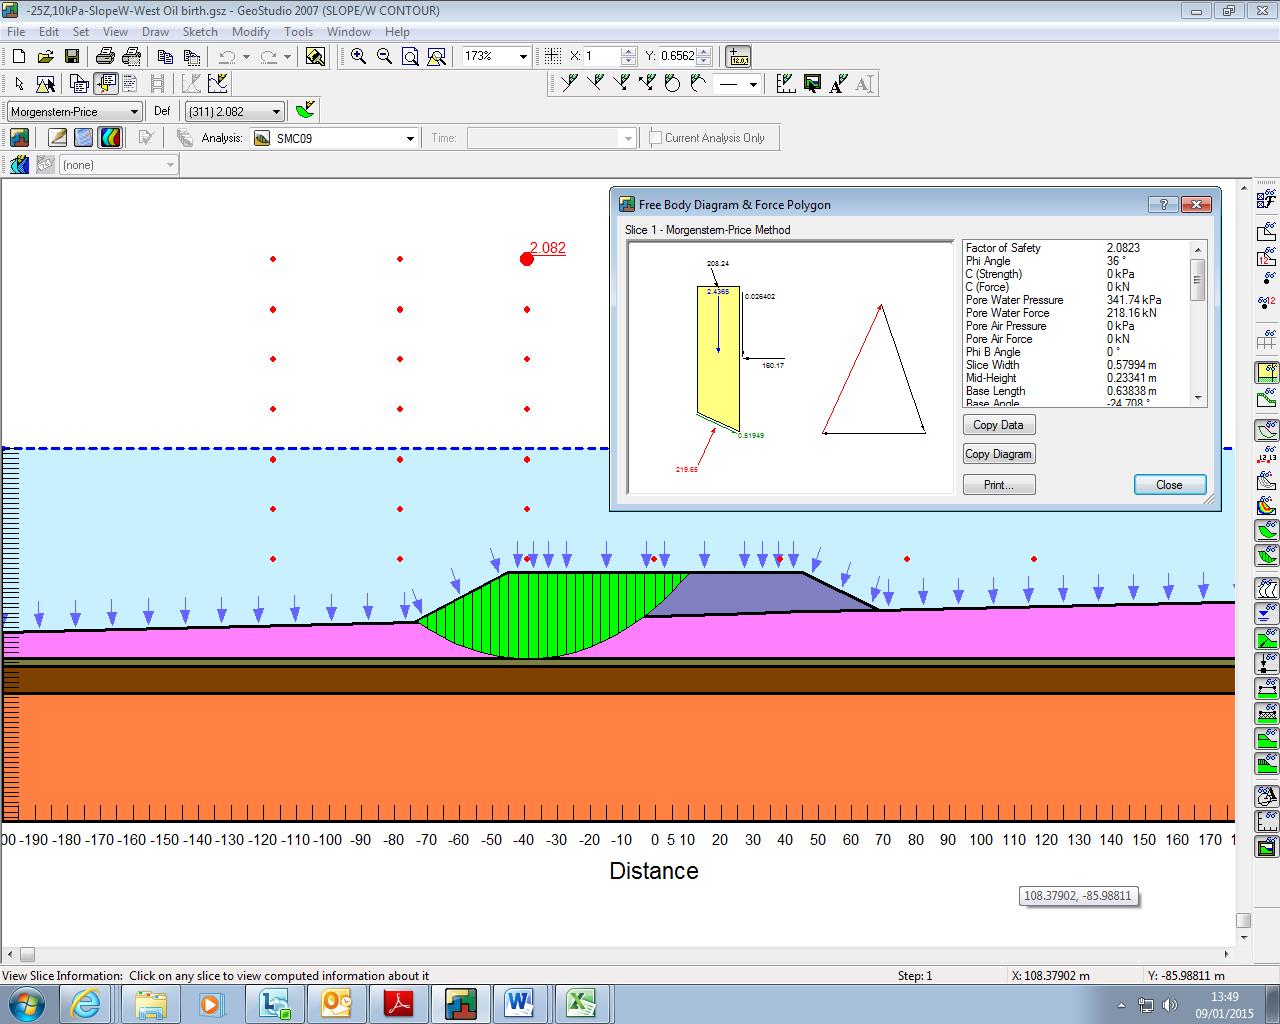
My second task on the project was to model part of the breakwater using the slope stability software SLOPE/W. Firstly I had to input the geometry of the problem and assign the initial material parameters which was the easy part! The software then calculates potential slip surfaces using stability of slices within a slip circle. The output is a factor of safety which must be above 1.15 in the temporary condition. I had to break the model down into stages starting with just the breakwater structure, then the concrete caisson followed by layers of fill in the caisson. Again this initially sounded simple until I had to incorporate the increase in strength of the silt due to consolidation. I had sudden flashbacks of John’s lecturers hammering against the board trying to get us to explain the difference of drained and undrained parameters. Well John, having read a few chapters in Craig’s Soil Mechanics book I think I get it!
The theory. When a fine grained material is loaded it is compressed and initially the load is taken by the pore water resulting in an increase in pore water pressure. The initial (undrained) strength is quite poor which is why fine grained materials often fail suddenly on loading (John’s grain silos). The excess pore water pressure dissipates at a rate depending on the permeability which results in the primary compression part of your 1D oedometer test curve. We also added vertical sand drains which shorten the drainage path and speeds up the rate of consolidation. As the excess pressure dissipates the load is transferred to the soil skeleton increasing the strength (drained conditions). Is that right John???
My task was to calculate the increase in strength after each month and adjust my model parameters accordingly. This became increasingly complex as different parts of the silt under the breakwater had different loading for varying durations. I finally managed to create a crazy spreadsheet and I got my model to take a caisson that was half full over around 4 months when disaster struck. The next 5m of fill caused a collapse even if the silt was left to consolidate 100% after the previous loadings. So it won’t work, back to the drawing board! One of the other guys has also been modelling the seismic effects and the structure also fails in sliding so we are now considering steel piles, it’s going to be one expensive project!
I have also been working on a project closer to home near Bermondsey station with part of the London Bridge upgrade. I had to understand the Bermondsey Dive Under Box concept of construction and write a specification for new trial holes as some of the low headroom bored piling did not work with the ground conditions. I suddenly realised that it’s quite difficult to dictate where the holes need to go having never been on site and only seen drawings of the proposed structure. I now feel really sorry for the design engineer from Buro Happold who I got really annoyed with at Battersea for wanting to put boreholes in really inconvenient places!
In summary I think this will be a good placement with plenty of support for CPR and a nice working environment. I actually get the time to sit and understand the principles before I start number crunching. The commute is okay at the moment and it is nice not to have to drive back somewhere on a Sunday evening, let’s hope I don’t end up posted to Kinloss next!

Well well well….everything filled me with a sort of parental pride …until, that is, pragraph 4 and again in para 7
My angst concerns the term ‘strength’ ……..because the drained strength is modelled with a Mohr-Coulomb failure criteria the shear resistance , on the shear plane, changes with effctive stress BUT the strength of the material is defined by phi’ and (but be careful!) c’ and these will be taken as material parameters and do not change(more of this later).
So in a model combining consolidation with slope failure the thing that’s effecting the shear strength is the change in pore pressure ( going down with time) . This is what should be being varied in the model..
..and here’s the rub….. the guess at how quickly it will change (in this case relative to the rate of fill) is given by the degree of consolidation (U) ( with lateral drainage induced into wicks or otherwise) U is a function of the coefficinet of consolidation cv….cv is…and I can hardly bring myself to say this , k/mv………mv is really (1/E) so cv is kx E
Among the many rants I would have exposed you to …..some would have been on the reliability of soil parameters …remember?
Well, in this problem, you’ve a full house…and then some…..If strength parameters are ureliable and stiffness is unrelaible squared…and permeability is unrelaible cubed….I’d have to take my shoes and socks off to work out how unrelaible cv was ….so have fun working out howthe pwp changes with time!
BTW I’d like to have the consolidation data…. got to be useful for teaching somewhere along the line..
Thanks John, there are still some gaps in my understanding that I am trying to fill in so that is helpful. Trying to find cv was a pain, blowing up one curve by measuring it with a ruler then trying to fit lines of best fit to get t100 and t50, all on log scales-it’s probably unreliable^10!!
Anyway after doing all that I then had to use the U values after each month to try and see if we could fill the caisson up. The silt is full of sand drains so we were also using Uv and Uh aswell! I managed to get the caisson half full but even when the pore pressures were 0 it still kept failing, so back to the drawing board!
Today I have been looking at the same problem in the long term drained condition and checking the seismic effects. On this we have been using phi and your favourite c’, I need to get my head round the formula that these are calculated from in the spreadsheet I inherited but it is to do with the geometry of the sand drains. I will forward you some spreadsheets tomorrow. I will also dig out on of the borehole sample pictures that shows how this silt is pretty much sludgy turd-I might make that a new classification!