Archive
The Lost Thome
Apologies its been so long since I lost posted, you poor people! I found this post drafted and ready, from before I went on summer leave. I must have neglected to actually put it on the site in the rush to get out of the door.
The Chiller Plant is nearing completion (structurally) and the steel sub contractor building it is starting to prepare for its next large steel erection task on site. Construction of the Chiller plant has been somewhat of a rehearsal for the construction of a large steel truss roof, architecturally designed to be the crown jewel of not just the JOC project but also an icon of the campus. Colloquially known as the ‘Bridge of the Enterprise’ because of its elliptical shape, it will be more of a challenge than the chiller plant. So far it has been high on peoples agenda because of the proximity to an adjacent site which will make de-confliction of crane picks impossible. Cue the start of night work. This is an interesting issue in itself because the adjacent project is c. 1 year behind schedule and so the impossible deconfliction issue is not of our making. In the ‘real world’ I am sure that there would be much less accommodation made for the late contractor and numerous claims for LDs and delays etc. However USACE is required to manage the programme and so the success of both projects must be considered.
We also had to throw the erection plan back to the PC this week. I was part of the team reviewing it and gave general input about compliance to the USACE health and safety manual (EM-385) as well as being the ‘Structural Lead’ for the JOC, whose real Structural Lead was in Hospital with his wife who had broken her fingers playing American Football. The plan seemed OK on the face of it; containing all elements required by EM-385 (the USACE H&S document). These include details of site location, material deliveries, staging and storage, co-ordination with other construction, crane type and capacity, lifting methods, pick path, site preparation descriptions, stability of the erection, certifications …etc. The main bit of concern to me was the actual description of the steel erection activities. Fairly key then.
The subbie had done a brilliant job of communicating the first stages of the job on a simple on pager with different colours corresponding to different stages of the phase. It highlighted what the safe ‘walk away’ point was, was easy to read and clear (PSB)
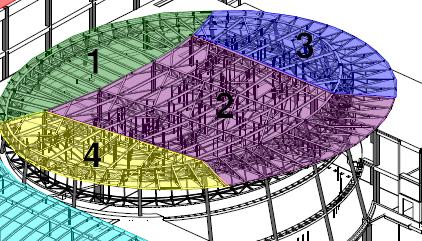
Colour Coded – showing sequences
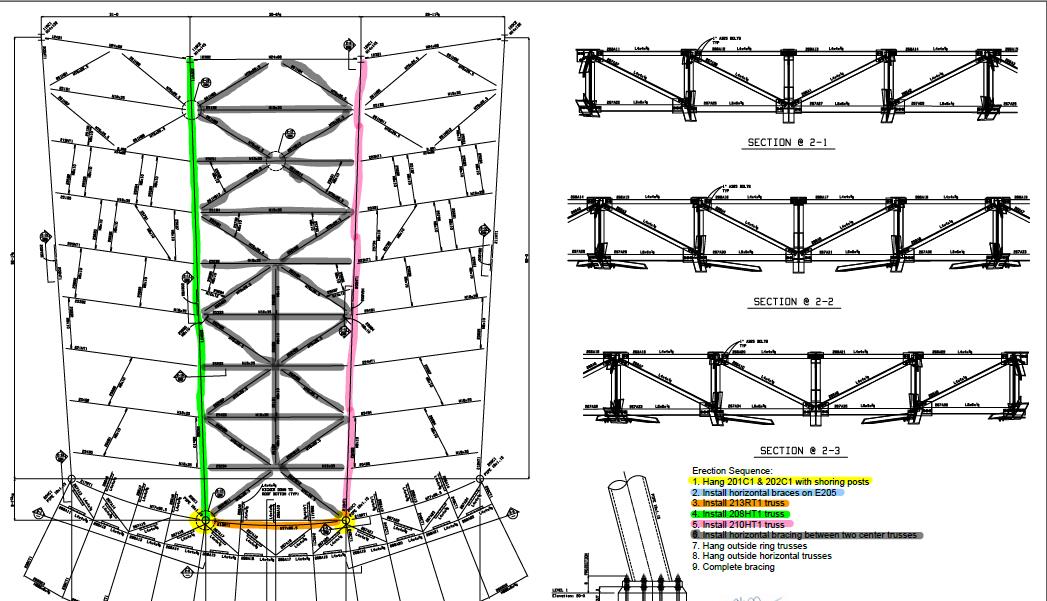
One of the sequences in detail
Unfortunately –
that’s where it stopped. I looked to the narrative for help, but it kept referencing other pages of the document, which was not paginated. It left me filling in the next stages based on assumptions and wooly assertions based on my knowledge of the project and a narrative that said ‘repeat steps 3 – 7’. To my mind totally inadequate. The erection plan itself should be a simple document that you could give to pretty much anybody who should then be able to look through and clearly identify at what stage the construction is at, what’s coming next and at what stage it is safe to terminate construction such that what’s already been built won’t fall down. If the subbie had simply done away with the narrative and continued with ten one-pagers I think the plan would have been much better.
So what’s the point of this bit of the post? 2 things: In the army we are gently encouraged to communicate on paper in set formats. This helps, and it’s a skill/requirement we perhaps take for granted. We can add a lot of value to a site / task / project through non-technical skills like these. But secondly the most complex of tasks can be communicated through the use of some simple, well thought out sketches. In this case, it would have been a lot better to have done so.
The Oil & Gas Industry
Following an amount of chat on whatsapp regarding shares and in particular oil & gas shares (and following Jim’s comment on my last blog) I thought it might be worth writing a small blog to let you know where the industry is at the moment, as it seems like the construction industry is ‘steady away’ while the oil & gas industry is on its arse!
The oil & Gas Industry – Where are we?
The industry is not in a good place right now and of course it all relates to the price of oil. Demand has decreased whilst supply has increased leading to significant problems for all involved, especially for those who have the highest extraction costs. Different people will have different views as to the cause of the current trough, but can be summarised as follows;
- Increase in production in the USA due to onshore fracking.
- Canada & Iraqi oil production and exports are rising year after year.
- OPEC declined to cut production.
- Decrease in demand from the far east.
- Conspiracy theory that the Saudis & USA want to hurt Russia & Iran.
- Conspiracy theory that OPEC want to drive the new USA fracking market into the ground (excused the pun).
To make matters worse, in order counter the fall, many producers have increased production.
The following is a history of Crude Oil prices since 2000 showing a significant drop in 2008, due to a combination of an oil drilling ban being lifted by the USA, easing of tensions between the US and Iran, a stronger US dollar and the likely decline in European demand. It also shows the most recent drop which is struggling to recover in the same way the 2008 drop did.

Price of Crude since 2000
So what?
So, unless it costs you less that the price of crude to extract the hydrocarbons, you are making a loss. Let me put it into context. The cost to extract from the North Sea is somewhere between $20 and $60 /bbl depending on the operator, type and location of reservoir etc. Each producer would typically assume an extra amount per bbl of say $10-20/ bbl as an investment cost for future improvements/developments etc. So unless you are at the far left of this scale then you are going to make minimal profit, if at all. Currently BP (North Sea) is in the bottom third.
What is BP North Sea doing?
For the last 12 months or so, BP have been on a big drive to reduce operating costs and try to get out of the ‘bottom third’. BP expect oil prices to remain low for some time to come and are taking quite a pessimistic view on this. In order to make the North Sea more profitable, BP have been looking at the following;
– Cutting staffing costs, circa 200 in the last year (circa 10%)
– Cutting back on OPEX & CAPEX budgets
– Prioritising projects that add the most valve for the business
– Delaying projects or extending projects to share cost with following year’s budget
– Increasing production to lower average cost of production
– Simplification across the business in order to reduce costs
To answer Jim’s question – Yes there is a reduction in our projects, but also a drop in manning, so still busy! The less important projects have been pushed to the right with the big ‘increase in production’ projects still moving forward.
The future
The price of oil is expected to remain low for some time, unless something significant happens that reduces global production. BP is continuing its drive to improve efficiency and simplicity and increase production, and is continuing to invest in existing plant and future developments. It has been working and BP is creeping towards the middle third.
The above information is not a recommendation to buy/sell shares, and is just the view, in part, of the author. The value of investments can go down in value as well as up, so you may get back less than what you invest. I certainly would listen to me since the BP shares I bought in Jun have dropped 30%!!
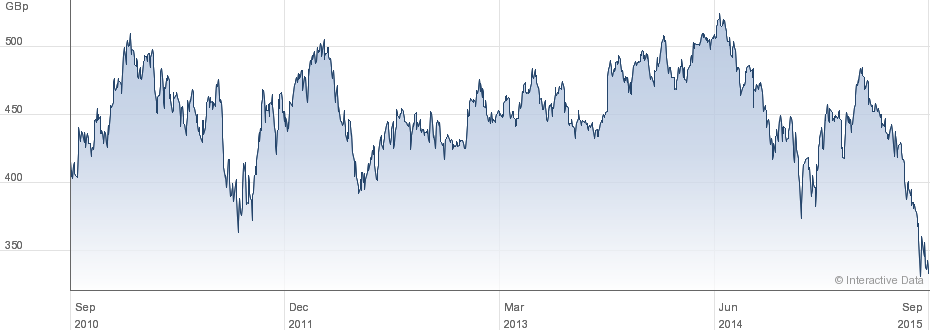
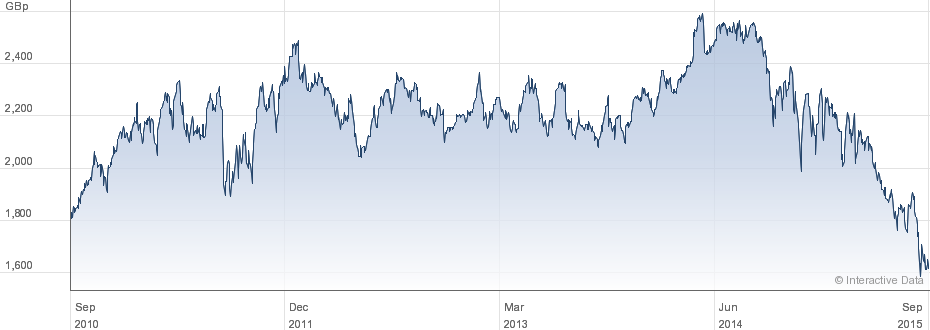
BP share price over the last 5 years
Shell share price over the last 5 years
Oz PCH – Ductwork Leakage Pressure Testing.
Introduction
As part of the commissioning of the Air-Handling Units (AHUs) one test is to ensure any air leakage, which results in loss of pressure, is kept to within allowable maximums. This blog briefly discusses a leakage test I witnessed for one of the High-Efficiency Particulate Arrestance/Air (HEPA) filters in the operating theatre department.
In the application of theatres the HEPA filter is part of the laminar flow hood situated directly over an operating table. Here the filter’s minimum resistance (pressure drop) to airflow is specified at around 300 – 400 Pa at 370 l/s flow rate. The effect felt by the patient undergoing an operation is one of a soft blanket of very clean air.
HEPA Filter Function
HEPA is a standard and not a type per se, set by the United States Department of Energy (DOE) and is only awarded to filters that satisfy certain standards of efficiency. To qualify as HEPA an air filter must remove 99.97% of particles that are of 0.3 micrometers (µm) in diameter.
HEPA standard filters are composed of a thin mat of randomly arranged fibres. Fibres are typically between 0.5 to 2.0 µm and made of fiberglass. The air space between fibres is typically > 0.3 µm and the common assumption that fibres smaller in diameter can pass through (like a sieve) is not true. HEPA filters are designed to target much smaller particles which get trapped, by sticking to the fibres, through the following mechanisms:
- Interception. Where particles following a line of flow in the air stream come within one radius of a fibre and adhere to it.
- Impaction. Where larger particles are unable to avoid fibres by following the curving contours of the air stream and are forced to embed in one of them directly; this effect increases with diminishing fibre separation and higher air flow velocity.
- Diffusion. An enhancing mechanism that is a result of the collision with gas molecules by the smallest particles, especially those < 0.1 µm in diameter, which are thereby impeded and delayed in their path through the filter and raises the probability that a particle will be stopped by either of the two mechanisms above; this mechanism becomes dominant at lower air flow velocities.
Figure 1 shows a typical filter layout/construction with pictorial explanation of the three types of filtration; interception, impact and diffusion.
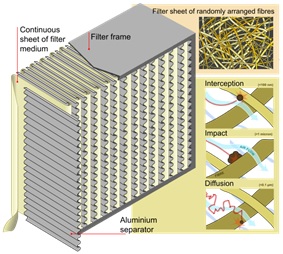
Figure 1. HEPA Filter Layout/Construction.
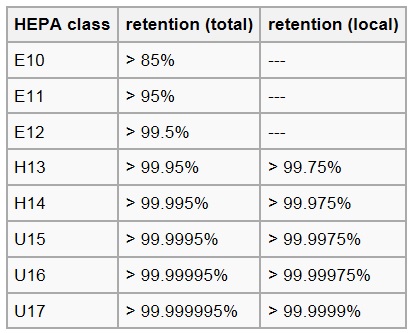
Figure 2. HEPA Filter Classification.
Figure 3 shows the laminar hood above the operating table in the operating theatre.
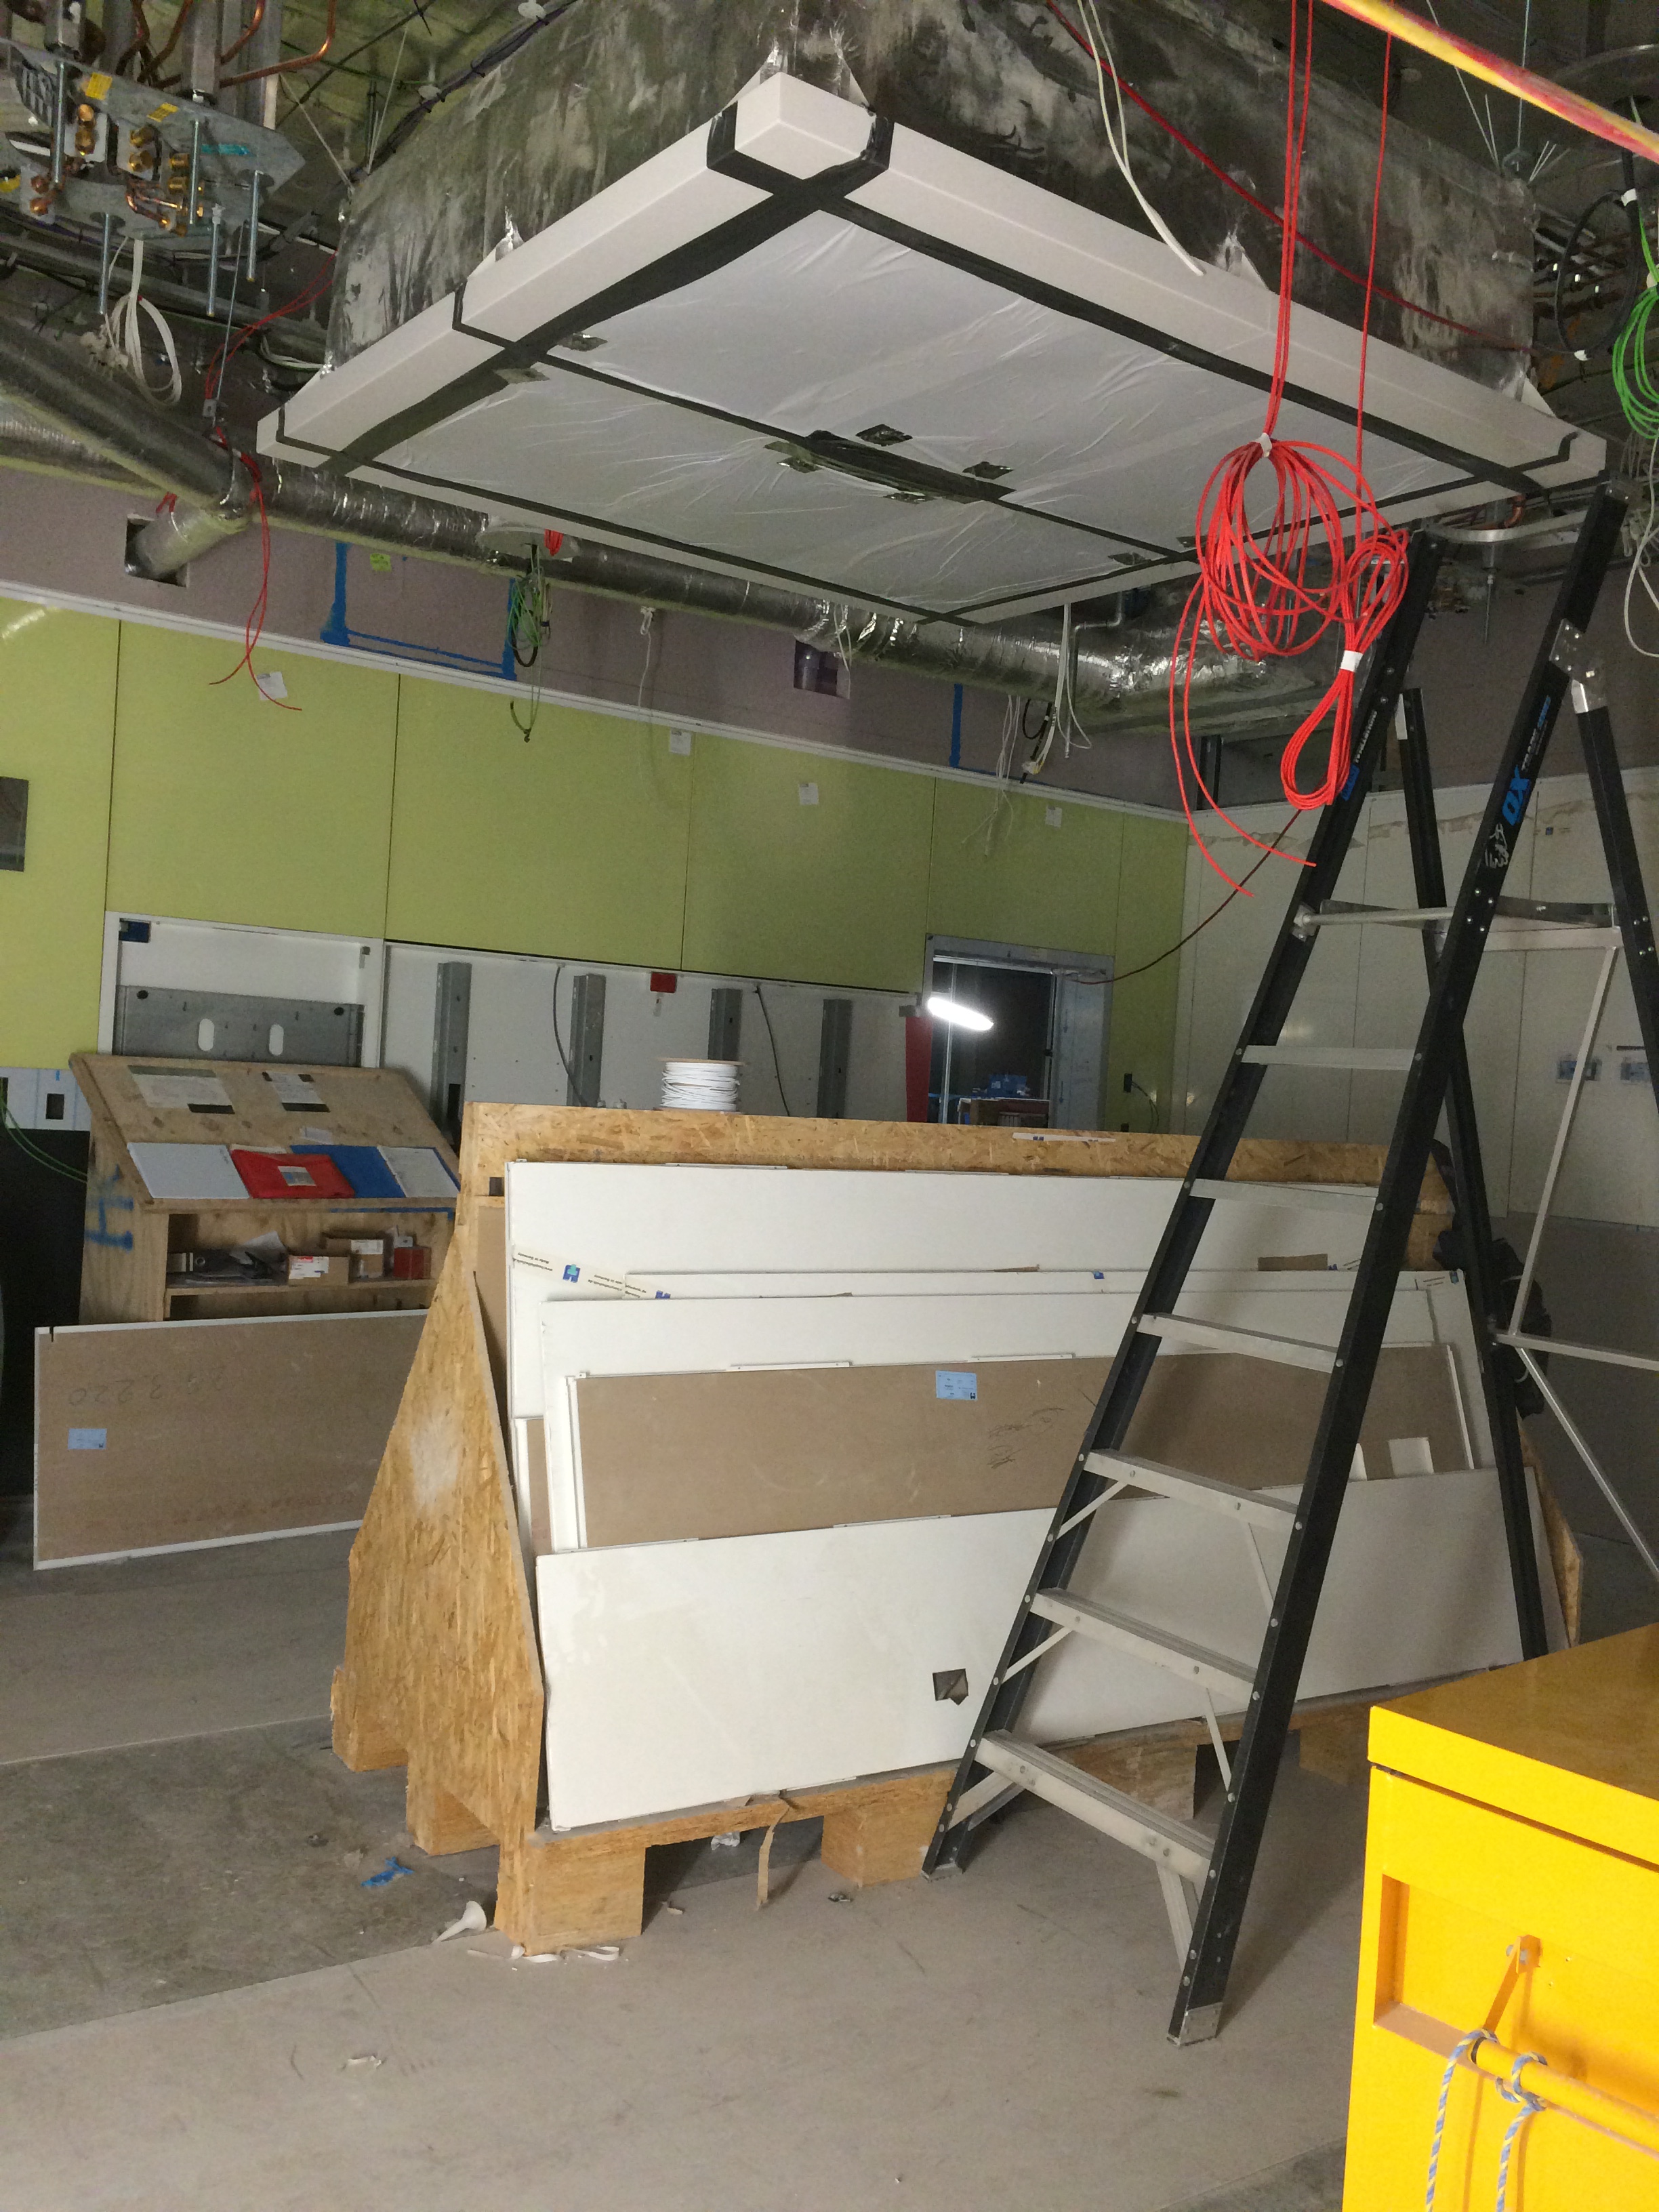
Figure 3. Laminar Flow Hood in Operating Theatre.
Fredon test to AS 4254 – Ductwork for Air-Handling in Buildings, which stipulates:
2.2.4 Air leakage
Duct systems with a capacity of 3000 L/s or greater shall be tested for air leakage at a static pressure of a minimum of 1.25 times the calculated design operating pressure in the tested duct section. Leakage shall not exceed 5% of the design air quantity for the duct system.
The systems in theatres are not greater than 3000 l/s of air so there was no actual requirement to test but Fredon conducted them regardless.
Leakage Test
As per the AS, 1.25 x our design pressure gives just below 750 Pa. The design pressure being the pressure produced by the fan plus any losses created by the Fan Coil Units/filters in the AHU (about 150 – 200 Pa) totalling around 600 Pa. The test achieved this and further more we were assured by Fredon that under normal operating conditions the duct would not reach this pressure.
The ductwork in question was one of four terminals branching off a single AHU (see fig 4). Each terminal has a flow rate of 370 l/s x 4 = 1480 l/s. Testing for a maximum of 5% leakage at a pressure of 750 Pa gives 5% of 1480 l/s = 74 l/s.
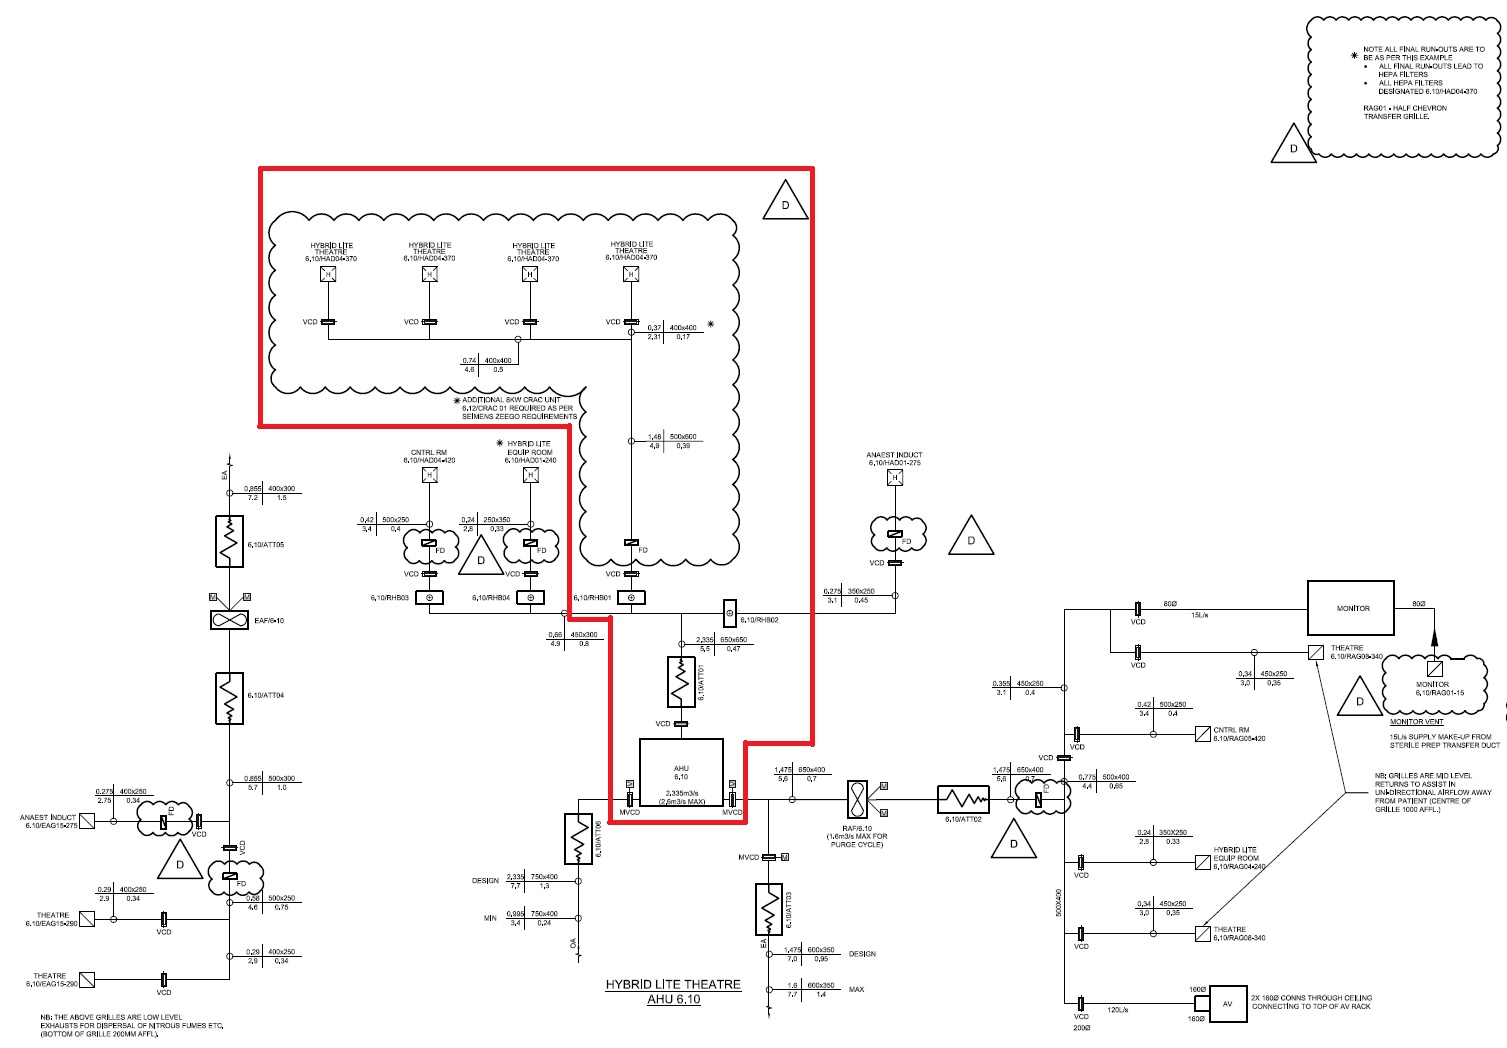
Figure 4. Schematic of AHU 6.10 showing 4 x Theatre Laminar Flow Hoods.

Figure 5. Leakage Test Sealing Plate and Hose.
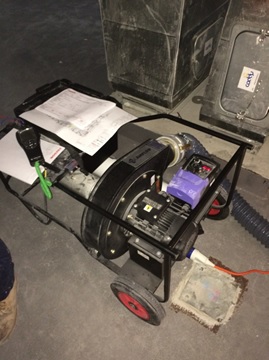
Figure 6. Leakage Test Rig.
Potential Issue
There was a potential issue raised as NDY, design consultant, stipulated in their design specification that ductwork should be tested to CIBSE standards – which refers to Heating and Ventilating Contractors’ Association (HVCA) DW/143 Ductwork Leakage Testing. Here it states that the system leakage loss for Class B medium pressure ductwork, under operating conditions, should not exceed 3% of the operating pressure.
Therefore, 3 % of 1480 l/s = 44.4 l/s.
So, 13 l/s is still well within the CIBSE/HVCA limits.
There was also a further potential issue in that the client may have wanted the test pressure to be the maximum for that class of ductwork, which is 1000 Pa operating pressure. As Fredon were adamant that the system would never operate above 750 Pa they were reluctant to test to this higher pressure.
In order to ascertain if the leakage would still be within the maximum limits due to the increased pressure a calculation could be conducted. There is no precise formula but it is generally accepted that leakage will increase in proportion to pressure to the power of 0.65 (HVCA 2000). This is due to leakage from ductwork occurring at the joints and seams and is therefore proportional to the total surface area of the ductwork in the system.
Therefore:
(1000/750)^0.65 = 1.2056.
1.2056 x 13 l/s = 15.76 l/s (for 1000 Pa). So, 15.76 l/s of 1480 l/s = 1.06% – still well within the 3% limit.
As it turned out the client did not request the 1000 Pa test pressure and so the calculation was not needed but at least it enabled me to investigate the issue.
Remaining Leakage Testing
Once all HEPA filters have been tested, from the plantroom through the slab to the hoods, and passed the ceilings can be closed and then the remaining ductwork from the plantroom slab back to the AHUs can be tested. This approach ensure concurrent activity for other trade contractors and by splitting up the ductwork Fredon can more easily identify and locate if an area of ductwork fails testing.
In Other News
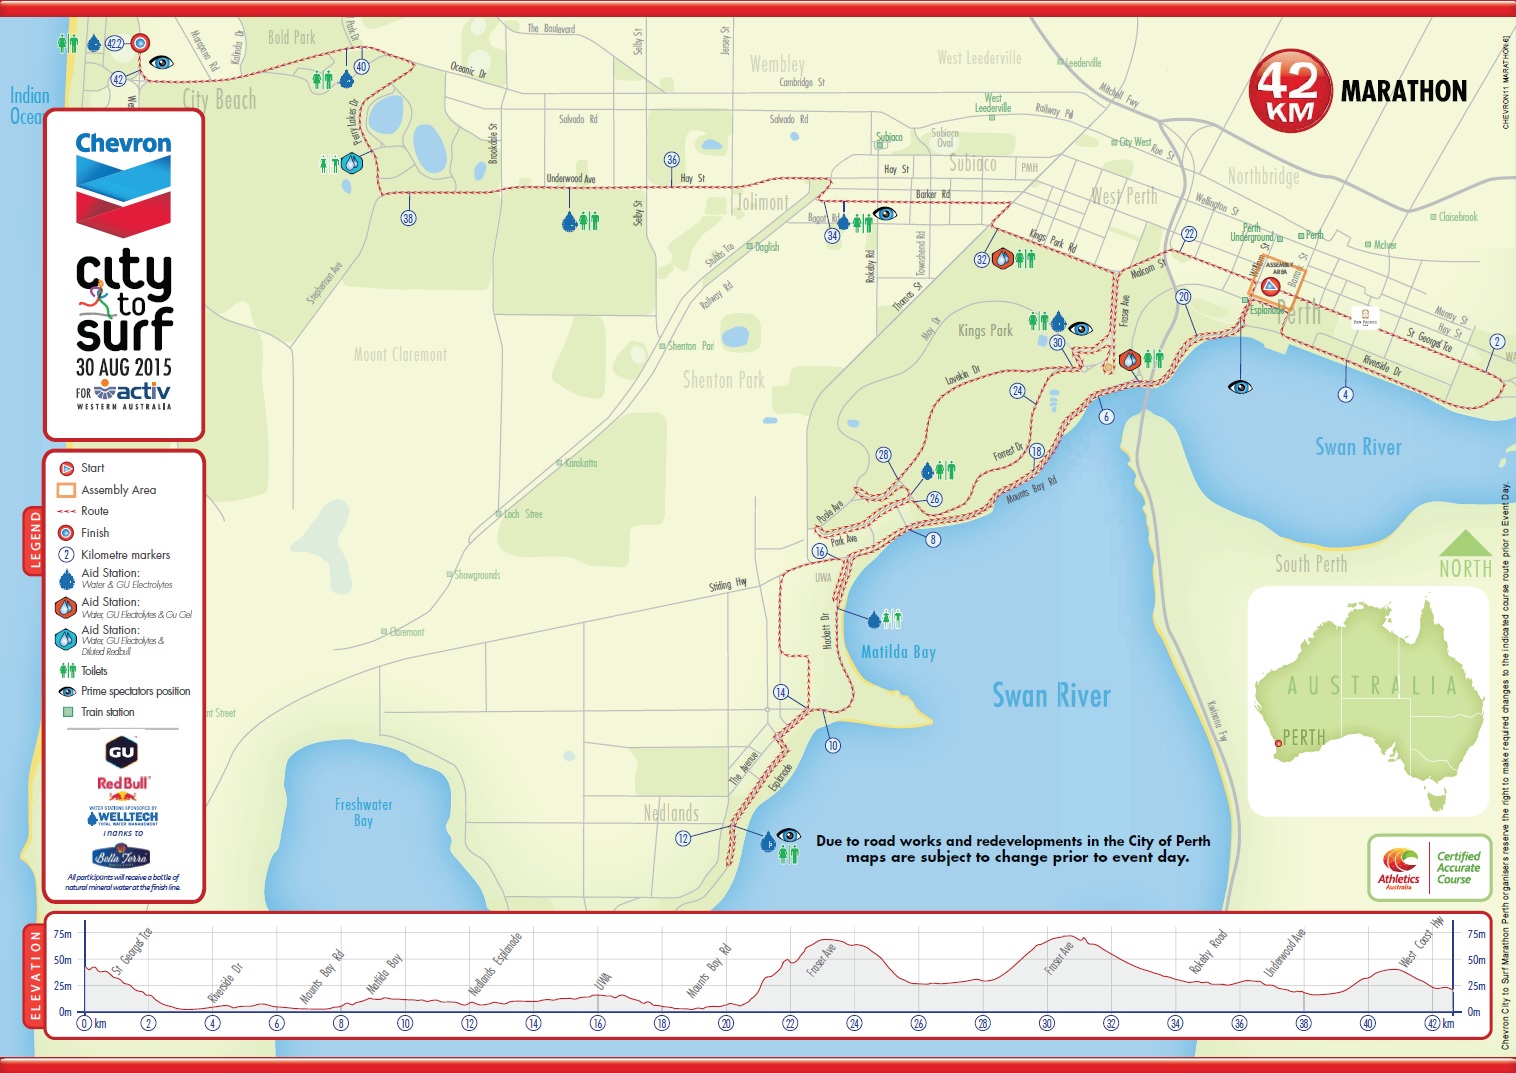
I completed the annual City 2 Surf Marathon at the weekend, my first standalone marathon, in 3hrs 30mins; pretty chuffed and it took till mid-week before I could properly walk, pain-free, up and down stairs!