Archive
Oz NDY – CPD Activities
Australian SAS Operator
Introduction
In similar fashion to the comments on Riche’s latest CPD blog, I too have been hunting out more formalised CPD activity opportunities. Although there are some within the design office I wanted to broaden my search and so started looking for opportunities outside of the workplace. Namely seminars, conferences and workshops delivered by professionals in the building services sector and that are affiliated to various engineering institutions.
This blog briefly discusses a seminar I attended hosted by Lighting Options Australia as part of the Society of Building Services Engineers WA Chapter in association with CIBSE.
Lighting Options Presentation
The seminar consisted of the usual finger food and drinks reception, with a studio tour followed by a technical presentation on LEDs in 2016, which culminated in a Q & A session.
The speaker, co-founder and MD of Lighting Options Australia has been involved in lighting throughout his 17 year working career, combining on-the-job experience and knowledge whilst working in partnership with several internationally renowned lighting brands.
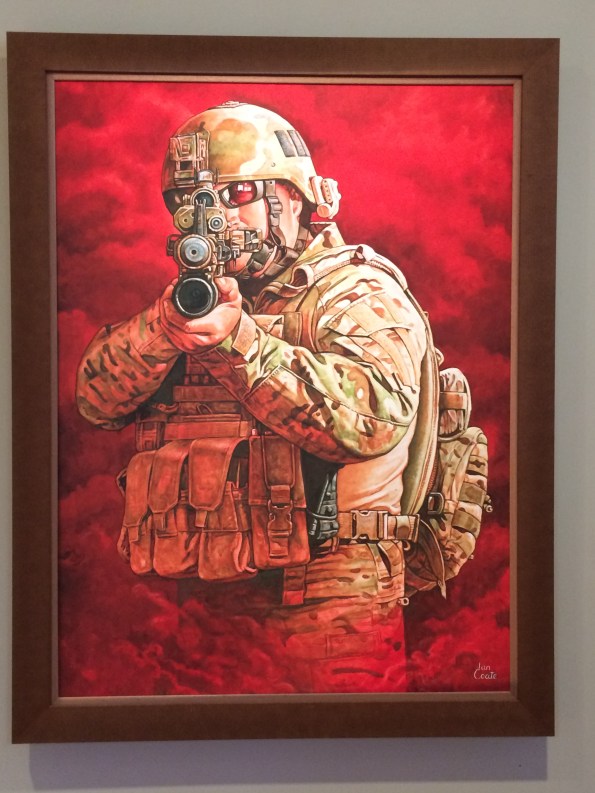
Before the presentation kicked-off the speaker demonstrated some of the lighting options used in their showroom gallery. One painting of interest was the Australian SAS Operator, which was painted by an ex-serviceman’s wife. It is said that whichever angle you look at it from, it always looks as though he is aiming directly at you.
The presentation covered three areas:
- LED performance in 2016.
- LED/Luminaire life and lumen maintenance.
- Introduction to Richard Kelly’s ‘Language of Light’.
Presentation Summary
- LED performance in 2016. Four factors were discussed: efficacy, colour tolerance, colour rendering index and failure rate.
- Efficacy. Luminous Efficacy is the measure of how well a light source produces visible light (to the naked eye). It is the lumen value against the energy consumption, measured in Lm/W. Manufacturers usually display this technical data along with the colour temperature, measured in Kelvin (K). For example, 100 Lm/W (3000K) or 130 Lm/W (4000K). The colour temperature describes the impact of colour, which gives either a warm light (<4000K) or a cold light (>4000K).
- Colour Tolerance. This is the colour consistency amongst exact same light sources, for example, an array of lights along an art gallery wall, where a higher colour variance in one source could be very noticeable and detract from the required lighting effect. There is a standard/tolerance for the acceptable degree of variation in colour temperature, ANSI specification C78.377-2008. The tolerances can be identified by applying the MacAdam Ellipses. The size of the ellipses is based on the standard variance called ‘steps’, the more steps the higher the variance and more obvious to the naked eye (see figure 1).
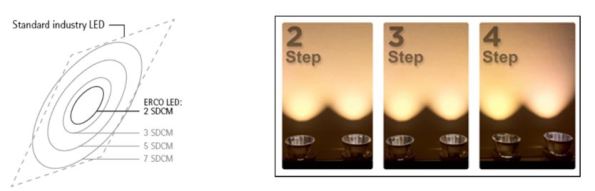
Figure 1. Colour Tolerance measured in MacAdam Steps
With the innovation of LEDs moving lighting technology away from the more traditional incandescent or compact fluorescent light sources, it introduces more variables where the Correlated Colour Temperature (CCT) of LEDs is liable to move further away from the target colour. Typically, incandescent and fluorescent ellipses don’t exceed 7 steps. Therefore, due to the easier identified colour variance, the LED standard states that CCTs must be within 4 steps MacAdam. The following link explains colour tolerance in more detail and is the source of reference.
http://www.lampslighting.co.uk/colour-tolerances/
- Colour Rendering Index. Colour rendering measures the light source’s ability to render colours correctly and is graded from 0-100. The old standard was to use eight colours to act as the controls against a pre-defined light source. This has now been increased to a 99 colour sample (see figure 2). The new sample range is more representative of real-world objects as opposed to the original and is intended to fairly and accurately characterise LED and legacy light sources.
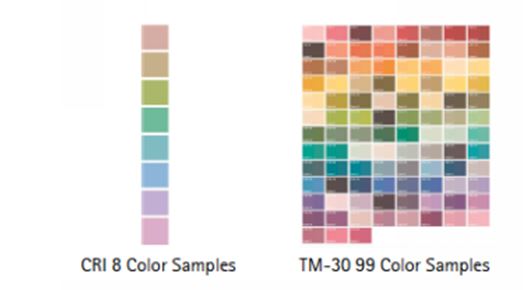
Figure 2. Colour Rendering Index.
Failure Rate. When conducting lighting design and planning off failure rates it is important to understand that traditional, incandescent and fluorescent, light sources are failure rated at 50% over their rated life, which indicate that the lamp has failed to the point of needing replacement. However, the standard failure rate in the LED market is 0.2% for 1,000hrs. That works out as 10% after 50,000hrs (the standard LED manufacturer specification failure rate which is extrapolated from an industry accepted standard of 8,000hrs burn time). The latest in LED technology, as manufactured by ERCO, has decreased this by 100 times to <0.1% for 50,000hrs. By example this means if using 100 x 10 LED chip luminaires in a project then only one single LED out of 1000 might fail after 50,000hrs.
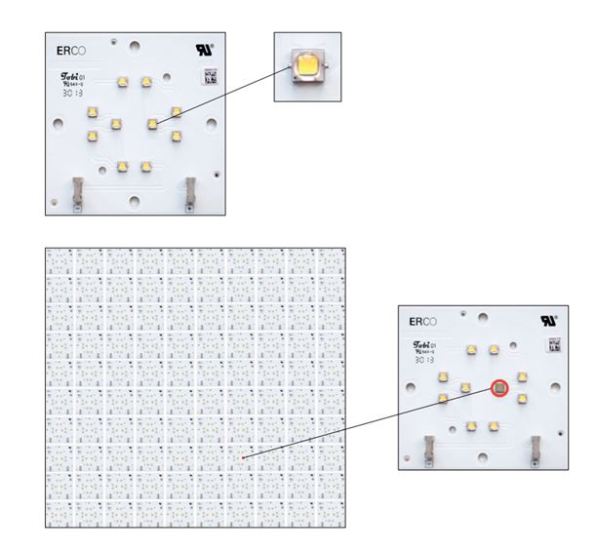
Figure 3. ERCO LED Failure Rate
2. LED/Luminaire life and lumen maintenance.
This part of the presentation discussed the characteristics that determine LED life and maintenance. There are four values:
- L – This is the light output of a LED module which decreases over its lifetime. L70 means the LED module will give 70% of its initial luminous flux. This value is always related to the number of operation testing hours (usually 8,000) and therefore is a statistical value so a batch of LED modules may have a slight variance in their lumen maintenance. A point to note is manufacturers should state the testing hours of their product as some try and mislead their customers by only testing to 4,000hrs. This means there is likely to be a higher percentage of error when extrapolating to the 50,000hrs rated life but they clearly do this as it halves their testing time to approx. 5.5 months thus cheaper to produce and get to market. If a product doesn’t say it’s testing hours it is safe to assume it is 4,000 and not 8,000hrs
- B – This is the degradation value of LED modules which are below the specific L values. So, L70 B10 means 10% of the LED modules are below 70% of the initial luminous flux.
- C – This is the value of fatal LED module failures, indicating the percentage of modules that will actually fail.
- F – This is the combination of B and C values, for example, L70 F10 means 10% of the LED modules may fail or be below 70% of the initial luminous flux. As a rule of thumb the most commonly used values are L and B. The LED market standard specification currently used is L70 B50 (50,000hrs), e.g. after 50,000hrs only 50% of the LEDs used still achieve 70% of their original luminous flux. ERCO uses LEDs with the specification L80 B10 (50,000hrs), e.g. after 50,000hrs at least 90% of the LEDs still active achieve 80% of their original luminous flux. Figure 4 shows the two graphs for comparison.
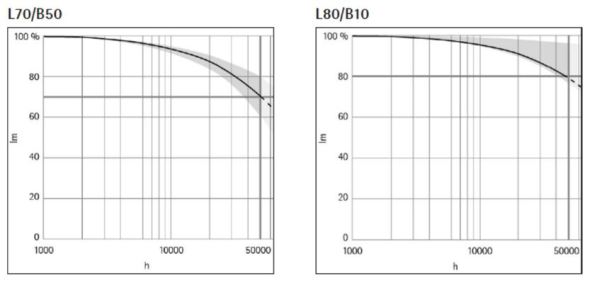
Figure 4. Traditional Vs ERCO LED Specification Maintenance/Failure Rate
Here’s the difference in a real life example:
There are 10 x LED downlights used to achieve an average 500 lx and rated at L70 B50 (50,000hrs).
At 50,000hrs – 500 lx x 0.7 = 350 lx
At 50,000hrs – 350 lx x 0.5 (worst case) = 175 lx
The same 10 x LED downlights are used to achieve an average 500 lx but this time rated at L80 B10 (50,000hrs).
At 50,000hrs – 500 lx x 0.8 = 400 lx
At 50,000hrs – 400 lx x 0.9 (worst case) = 360 lx
So you can see using the L80 B10 specification retains 72% of the original lux level after 50,000hrs versus just 35% if using L70 B50.
3. Introduction to Richard Kelly’s ‘Language of Light’. The final part talked about the American lighting designer, Richard Kelly, who was said to have been one of the pioneers in architectural lighting design. One of his goals was to be able to get both architects and lighting design engineers to speak the same ‘language of light’. To achieve this he came up with a very basic concept that broke light down in to three simple elements:
- Ambient – ‘Ambient luminescence’ is the element of light that provides general illumination, ensuring the surrounding space, its objects and any people in it are visible. This form of lighting facilitates general orientation and activity. Ambient luminescence is the foundation for a more comprehensive lighting design and aims to have differentiated lighting that builds upon base layers of ambient light.

Ambient
2. Accent – ‘Focal glow’ is the light that helps to convey information and guide movement. Brightly lit areas automatically draw our attention. Directed light accentuates focal points and helps to establish a hierarchy of perception using brightness and contrast, helping to emphasis important areas and accelerate spatial orientation.
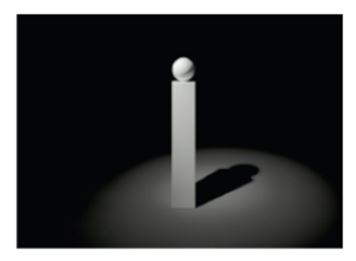
Accent
3. Scenic – ‘Play of brilliants’ results from the ability of light to represent information in and of itself. It covers a multitude of lighting effects used for their own sake, for atmospheric or decorative reasons, but having no specific practical function. Examples include, an emotive candle on a table, a fire place, an object of coloured light being used to influence the ‘climate’ of a space.

Scenic
Examples of all three elements combined can be seen in the following photos:
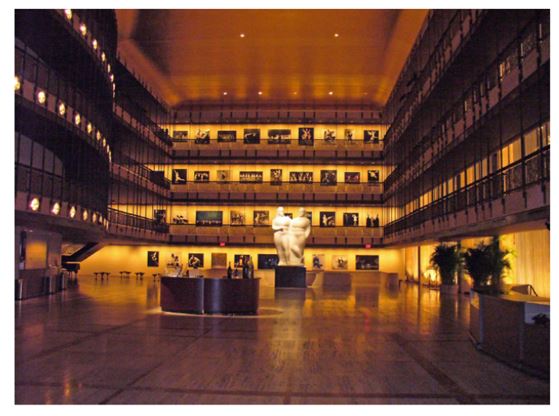
The State Theatre, New York
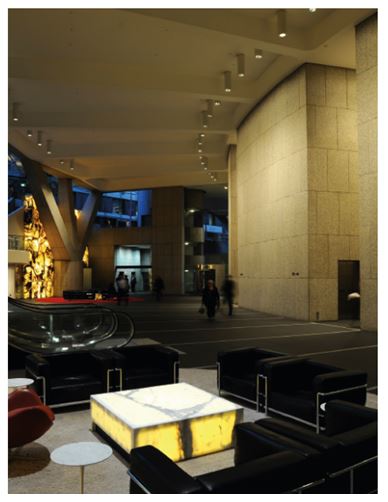
Grovsvenor Place, Sydney
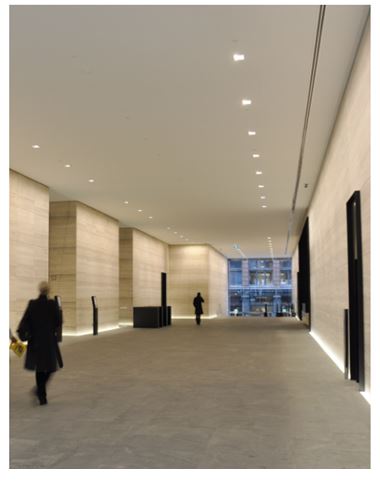
171 Collins Street, Melbourne
Forthcoming Events
Having chatted to the CIBSE Fellow who organised the event I am now in his ‘in-tray’ for any upcoming events which he assured me are roughly one per month covering various building services topics.
Safety in Design
Since arriving at KBR I have been involved in various elements of Safety in Design (SID). I don’t recall the subject being touched on in great detail on Phase 1, but it forms part of the core business of the design team. This blog gives at introduction to the systems used by KBR and some of the key issues I have witnessed so far. The basic steps in the KBR SID process are covered below, how the fit into the design process is illustrated in Fig 1.
Hazard Identification (HAZID) studies are generally conducted at an early stage in the design by senior designer and the client. Identifying key hazards early means that they are revealed before significant costs have been occurred in the design process. It also means that if they are unavoidable further risk reduction measures are actioned during the detailed design.
Construction Hazard Assessment Implication Review (CHAIR) is a tool to assist designers, constructors, clients and other key stakeholders to come together to reduce construction, maintenance and demolition safety risks associated with a design. The design can be considered as a whole or sub systems. Generic guidewords are used to identify hazards associated with three stages of a project; concept, construction (also including demolition) and maintenance and repair.
Hazard and Operability (HAZOP) studies are carried out as the detailed design is beginning to go firm. It is a detailed hazard and operability problem identification process, carried out by a team generally including representation from the client, operators/maintainers, suppliers, designers and installers. The design is broken down into ‘nodes’ related to how the system is designed to operate. Then various guidewords are used to provide out of normal operation scenarios. For each one the risk, cause and consequence are recorded, along with a solution if agreed or an action.
Control Hazard and Operability (CHAZOP) studies are carried out once the control narrative is complete. Similar to the HAZOP the CHAZOP study uses a number of guidewords to study deviations from design intent caused by computer/control issues.
Although this looks like a very linear progression in reality it is very iterative with the feedback from various stages been integrated and reviewed before the next. All of these processes are recorded and form part of a SID report for each project. This then provides a log of how a design developed and why decisions were made. It forms a key piece of evidence should something go wrong with a plant in the future.
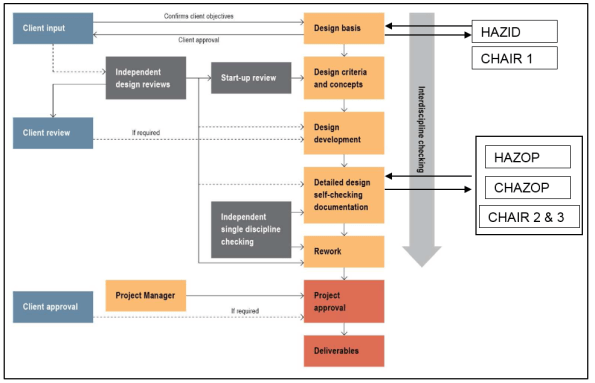
Fig 1 – The Design and SID Process
So far I have facilitated a couple of HAZOP and CHAIR meetings already and taken part into a few more. Some of the issues I have picked up so far include:
- The importance of the leader – the lead of the workshop is a key role. They need to keep the group on track, ensure all key information is recorded and prevent discussion going down various potential rabbit holes.
- Time Management – The key to the meetings is to identify hazards not solve them. Should a point take more than the allotted ten minutes it needs to be reviewed separately.
- Time Allocation – The workshop needs to have sufficient time allowance and should be broken up if possible. Generally the sessions I have been to have lasted all day and the level of interest thus the quality of the output drops throughout the day. Sequencing to allow the high risks elements first can also assist with this, as do sugary snacks.
- Design Quality – The design needs to be of sufficient quality and detail to allow the workshop to take place, otherwise it’s a waste of everyone’s time.
- Preparation – The designs need to be sent out in ample time for everyone to review and submit comments prior to the workshop – otherwise you risk the workshop disintegrating into a design review.
- Attendance – Make sure the correct number of people are present. Too many and the discussions take too long, two few or the wrong attendance and key items could be missed.
- Variations – Often this is the first time the client has looked at the design in detail and from my experience so far they try to use the opportunity to add things to the design. As mentioned previously the purpose of these workshops is to identify potential hazards, not work out who is commercially responsible.
CCB – Ft LEE Training Facility
The ‘museum’ is still behind schedule. 95% submission is due mid – late march, a 3 month delay on the original. A rendering of the building is below, with my portion of responsibility shaded.
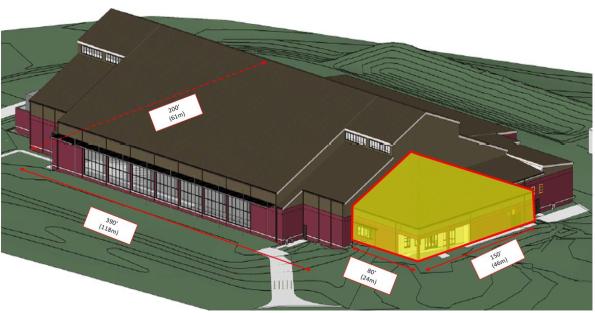
Ft Lee Training Facility
The larger space is largely progressed however the shaded portion, which is structurally separate, had not been looked at, other than producing a column grid and an interior plan. The promoter intends the space to be open plan admin and teaching space. Therefore a rigid frame layout is required instead of braced. This is comprised of lateral and gravity beams and columns, (with the latter being pinned at the ends, hence not transferring moment). I designed the frame keeping the lateral frames symmetrical as much as possible to reduce torsional effects induced by any wind or seismic loading. If there is not enough rigidity in the structure after running the seismic calculations I have enough ‘spare’ gravity columns which I can make into lateral columns to stiffen up the frame and retain some symmetry.

Structural Frame Design
The loading of the structure has been affected by the Protective Design Center (Sic) (PDC) who have said that the cold formed steel truss system proposed for the roof doesn’t meet blast requirements. This is strange because stud walls and metal decks, which also consist of cold formed steel, are adequate systems. To me this means that either they haven’t been able to test the particular roof truss system in question, or there is an issue with the truss connections. The roof system is ‘designed by others’ so options were to either specify a requirement for hot rolled angles to form the roof truss or provide a second roof. The first option would greatly increase the weight of the roof and affect seismic design as well as costs whilst the second (selected) requires joists and decking. That means that the load paths need to be considered and modelled appropriately. Instead of having the ‘high roof’ which will transfer the wind and snow loads into the frame, sitting across the joists it will sit directly onto the main frame. Modelling roof loading across the flat roof decking would incorrectly increase the joist size and would increase the costs unnecessarily. I will therefore model the ‘high roof’ loading as line loads running across the beam lines as shown below.
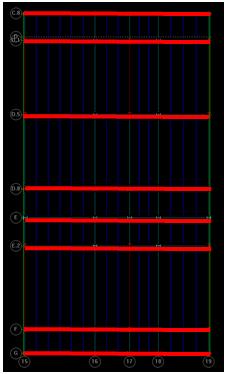
High Roof Loading Model
I will input the permanent and variable loads for the roof based on the relevant standards (in the same way as we get our values form the ECs) but I will also need to manually calculate and input the snow drift loads. These, along with the seismic loads have not been calculated for my portion of the building so I am grabbing as many design examples, codes and text books as I can, to handrail. The computer will automatically model the wind and seismic loading which I can cross reference with hand calcs.
Environmentally the site as a whole is legally required to maintain similar conditions to the pre-construction water run off conditions, in line with the Energy Independence and Security Act 07 (EISA 07). This ‘low impact development’ (LID) approach is managed by the civils (site development) department who will design in methods to ensure the targets are met. These targets will be set by the initial site assessment which will look at things such as hazmat risks (POL), asbestos water quality and quantity of run off.
The promoter will budget the costs of the designed measures (swales, pervious parking areas, filter strips, and vegetated buffers etc) which are required to maintain the site at or close to its pre-construction state. The estimated costs are entered as a separate line item on the form that is required to request project funds from congress and are based on 2% of the overall ‘supporting facilities’ cost. This policy is intended to ensure that all government projects have adequate funds available to cover any LID requirements. ‘Supporting facilities’ are anything that isn’t the constructed asset itself and includes such things as the electric, gas and sewer service costs, pavements, storm drains, ATFP and any other site improvement / demo costs. For this project the ‘supporting facilities costs are estimated to be $5.5 million, therefore implementing the LID measures has $110,000 budgeted. This will presumably form one of the constraints on the design. To me the figure feels low considering some of the effort that is required to treat water before it is discharged from site in line with EISA 07, however this line item will be added to all the others for the project and a 5% contingency added to it.
Building 8607 Renovation, Ft Meade. The Design Build RFP (aka ITT) sections are produced by the different departments in the Engineering Branch. I helped the costing effort by producing a rough schedule of quantities expected in the ATFP upgrades. I based this on drawings which were used in the upgrade of a similar project which used the alternate path method of hanging floors using tension rods in the event of a column removal.


With the odd exception most values required by the estimating department were in tonnes, so fixtures and fittings (bolts etc) had to be converted from individual units. Other bits of work, for example welding or demolition of walls, was required in linear or square feet. I was a bit stumped by how I should tackle the installation of the lift but was advised that a line saying ‘1 x lift’ was sufficient! Whilst I was happy enough with that it occurred to me that it would probably be a bit of a waste of time for me to do that because there are people who are much better placed to do it. My value came in understanding the structural components of the ATFP system and being able to dig into the weeds of that. The selected ‘preferred’ ATFP method has been based on the fact that it has been done before, and that is what has dictated the government estimate. However, the contractor may well decide to completely re-build the concrete framing and install a tie force method of ATFP while he’s at it. This could potentially mean that the government estimate is a long way off the contractor estimate which, if realised, will introduce a bit of risk into the tender process because it will increase the complexity, hence increase the duration, of the negotiation process. Having said that we had to start somewhere and using precedent seems as good a place as any in this instance.
Access Control Point, Ft Meade – This project is now due to start in July 16.
