Risk-based Cost Estimating
One of my recommendations in an early AER was that the APM method (bottom-up) of estimating was useable and effective in forecasting my budgets. Another was that line items in a risk register should not be expected to occur in isolation – they often work in alliance e.g. groundwater slowing shaft excavation and affecting tunnelling rate (critical path). Three separate cost codes which were all affected by one item. In my next breath I am going to retract my first recommendation and offer you risk-based cost estimating.
My job in design is a small one worth less than my annual salary, but there have been a few golden nuggets to take away. One of my deliverables in the detailed design for a highway widening scheme is an estimate on what the works are likely to cost, using the Client’s risk-based cost estimate template. It is essentially a Monte-Carlo analysis (M-C).
Similar to the RMS (Root Mean Square) method, the M-C identifies that the likelihood of all maximum risk values occurring on one project is low. Using data which the user inputs, it models thousands of possible scenarios (or risks) on a project occurring to greater and lesser degrees.
I modelled a simple fantasy project with the same worst, most likely and best case costs using the PERT analysis, and compared the results with the M-C. The end product is a normal distribution curve (screenshot below) which gives you the likelihood or confidence (%) of the project costing ‘X’ (£).
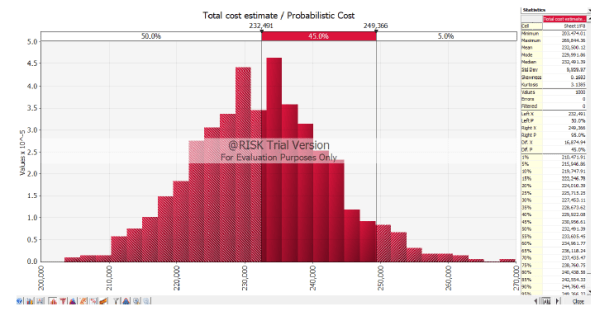
The PERT results gave me a 50% chance that the project would cost $232k, and a 95% chance that it would cost $268k.
The M-C 50% result was also $232k, but I could be 95% sure it could be done for $249k.
So what? As a Client with numerous projects in a programme, you’d be better informed on where to put your money.
I’ve now used bottom-up estimating, PERT, RMS and M-C. All have their pros and cons but the RMS and M-C must be considered the better options. I would argue that unless you have the M-C software package, or Damo to build one on excel, the RMS is sufficient. Both share the same limitation in that they inevitably spit out numbers based on subjective information – garbage in is garbage out. There lies the risk within the risk analysis.

Daz, very interesting commercial blog. Randomly something similar (managing risk) came up the other day with what seems to me to be guess work. How do the systems you have used go from a broad risk such as ‘finding uxo’ or ‘unforeseen ground conditions’ to quantify it with a financial numerical output? For example if there is a ground investigation planned does this reduce risk (lower cost) or if the site is well known, eg development say on the Olympic Park in UK, does that reduce risk? Or does the user make these kind of judgements when inputting values in the first place? I think what am asking is what are the metrics used and how is the probability of an event occurring worked out? Have you seen people applying greater rigor of analysis to more uncertain events, which makes assumptions more risky/uncertain than the original thing you were trying to manage?
Out of interest have you seen any ‘before and after’ case studies to see how well/accurate the analysis worked?
Damo, thanks for questions. I had to read your comment a few times to understand exactly what you’re asking so if I don’t answer the question(s) it’s because I don’t know. This response is my take on it……
Just planning a GI doesn’t reduce risk at all. That would still amount to gambling in my opinion. Actually doing a GI and analysing the findings for more informed input into a risk analysis framework would be risk management.
You input your best, most likely and worst case scenarios for a number of activities. The M-C is therefore running scenarios based on what you thought could happen in the first place.
e.g. Scenario A: Let’s plan a GI to see if there is groundwater. So what? Well, nothing. The £ value you assign to that risk is going to be the same as if you never planned one at all (assume most likely £5 risk budget, worst case £8).
Scenario B: We do a GI and establish the groundwater regime is negligible (allocate £2 most likely and £4 worst case risk budget).
If we did this 10 times we could allocate £80 to a risk that would only need £20 to manage, if anything at all.
In terms of probability, I assume that because your ‘most likely’ is, funnily enough, most likely, and therefore probability is always going to linger somewhere near the ‘most likelies’ (provided you haven’t put garbage in).
I think the value from the M-C is realised by the 95th percentile return, because this is where you should have 95% confidence that the budget won’t exceed that figure.
If we used worst and best case inputs in scenarios A and B that were only 2p off the most likely, the return from M-C would be worthless. The same would apply if we went too far extreme the other way (such as in the case of not doing the GI).
Risk analysis software is probably mis-labelled as it doesn’t actually analyse risk, it just crunches the numbers we give it.
No, I haven’t seen anyone apply any rigour of analysis. We failed miserably with our risk assessment and this was due to no SI (I blogged about that before).
I open the floor to debate……
Well, well, well ….as funny would have it Joe Wood did a thesis on this very topic a year or two ago.
His observation on his phase 2 site was that there were ground risks that turned up ; that should have been detected under a half decent s.i.
So a well worn title was used ‘ You pay for s.i. whether you have one or not’
Here’s what he did…if I can recall.
He set up a set of possible risk outcomes ( linked to boundaries properties , ground water and contamination) ; placed a 95% upper cost and a mean risk cost on a range of issues
Set up a spreadsheet which did the following:
Randomly selected a point on the risk curve for every contributing risk
Randomly put the outcomes of the set of risk issues together
To give an overall distribution of risk cost ( more or less what an M-C approach does)
To give a global mean and 95% cost based on the random groups of risks occurring randomly together ( running the pseudo random generation over 1000 times per run – so the risks randomly occurring and randomly put together to give a single cost point and then all the points plotted in a frequency distribution)
Looked at the original cost of his project
Looked at the added risk cost ( that had occurred in the ground)
Compared this with the Monte Carlo simulated risk costs
I cannot recall whether he went as far as changing the risk cost on the basis of an upfront si cost to mitigate the downstream risks
What was interesting was that the M-C simulation to generate a risk profile
As I recall you could level the critique that the M-C simulation output could be weighted by assuming outlandish input 50% and 95% costs, but since the normal expenditure on si is 1% or less of the capital cost , it was pretty insensitive to demonstrating that a higher si input cost could always be justified
I would guess that sophisticated M-C approaches arise that somehow do not treat all of the risks as independently randomly varying ( Daz’s early point).
But it was good fun
Someone – with a serious face – said to me ‘ oh yeah we always use M-C simulation based cost estimating at 170’……..Hmmmmmmm