Archive
SLOPE STABILITY ASSESSMENT FOR TOWER CRANE ERECTION
Apologies for the long winded explanation that follows this intro! In summary, I have a slope stability problem and if anybody could provide solutions in addition to the ones I’ve suggested below that would be great. My solution also requires fill that I assume would need to be compacted? Has anyone done any work on compacted effort required in coarse grain soils? Any other thoughts appreciated also.
My primary responsibility at the moment is managing the construction of the tower crane for the SEB site. This has principally involved managing and coordinating contractors to ensure that all enabling activity is completed for this Saturday (1 July 17).
The tower crane will be constructed in sections through the use of another 300 tonne mobile crane. Figure 1 below shows the site layout for the tower crane construction. The main boom arm will be constructed on the road before being lifted into position. The red highlighted area shows the extents of a slope which separates the two construction zones (North and South) and the blue highlights the outrigger pad areas.

Figure 1 – Site layout for tower crane construction.
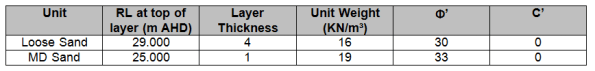
The crane company are required to complete a lift study for the exact location of the crane in order to accurately calculate their maximum boom radius and resulting loads that will be transferred into the ground via the outriggers. During planning the location as shown in figure 1 was agreed and a lift study was completed by the crane subcontractor. The resulting loads were 90 tonnes through each outrigger, which with pads of 2.5 x 2.5 m creates an operating stress of 144Kpa (I conducted a quick bearing capacity check for the loose sand layer to 2.5m which produced a stress at which failure occurs of 360kpa. No FOS!). One of our contract clauses requires MPX to complete DCP testing for any activity requiring outriggers. It was only once the positions of the outriggers were placed on the ground that I realised that we could have a possible slope stability issue. The image below shows the profile of the slope and the position of the mobile crane outriggers.
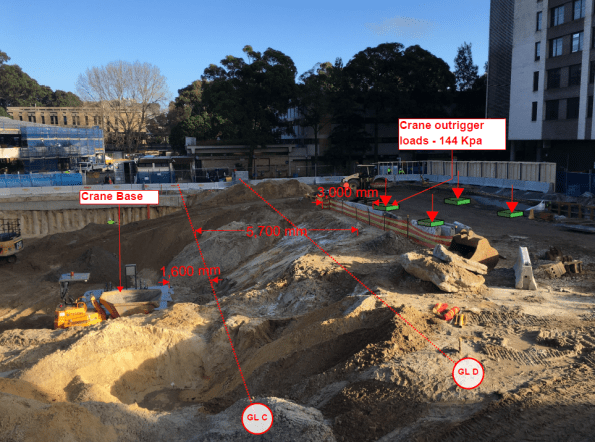
Figure 2 – Current slope profile and position of 300T Mobile crane
The proximity of the outrigger pads to the crest of the slope was a concern. The geotechnical engineer had also specified batters of 2:1 (H:V) throughout. The slope was clearly not 2H:1V. It was almost 1:1 with reduced level (RL) at the top of crane base of 24.000m AHD and a RL of 29.000m AHD at the top of the slope.
Transferring risk is the Multiplex way and the decision was made to get the Geo consultant (Coffey) to inspect and approve a solution. They will be visiting site tomorrow!
Smelling an opportunity to conduct some much-loved geo analysis, I immediately leapt into action and retrieved my John Moran Slope Stability notes in order to see if the current slope would be safe. About an hour or so later I realised that I was stumped. I understood the Bishop’s method of slices, but I couldn’t see how to model the surcharge load created by the crane outriggers (any advice would be appreciated).
I eventually decided to go back to first principles and use the equilibrium equation ∑M = 0. The idea was to take moments (resisting moments divided by disturbing moments) about the origin of the slope to determine a factor of safety (FOS).
Assumptions:
- No GEO reduction in soil parameters. All ϕ’ values etc taken from Coffey’s GDR.
- GWL is at measured mean levels (22.6m AHD) and therefore no pore pressures considered in calculations.
- Failure would be a circular slope within the loose sand layer (this was also based on the fact that the pile cap would provide toe stability and additional anti-clockwise moments about the origin).
- No consideration made in hand calculations for DC1 or DC2 i.e. factoring the soil parameters of loads.
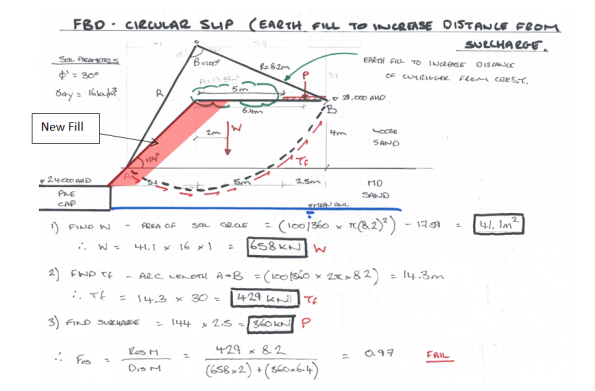
Figure 3 below shows my hand calculations for the existing site conditions. The FOS was 0.91; so a risk that the slope would fail if not modified.
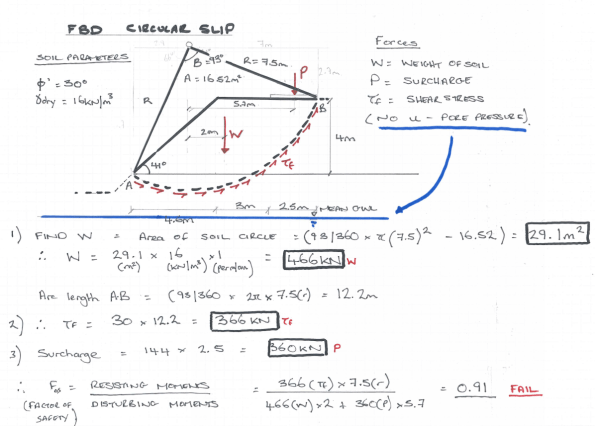
Figure 3 – Slope stability hand calculations for current soil profile.
When looking at solutions to this problem I could see 2 possible solutions:
- Place additional fill on the slope to increase the distance of the surcharge from the crest to 5 metres.
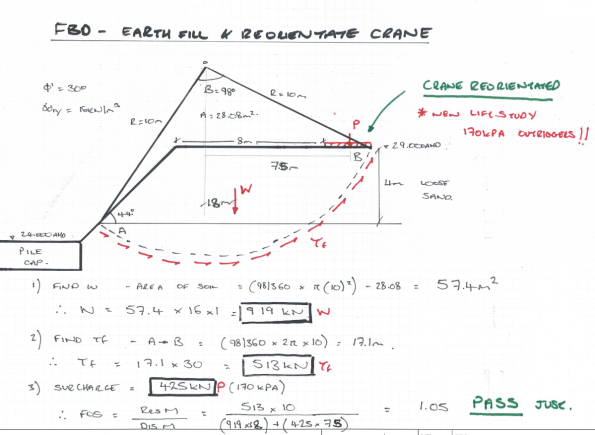
- As above, but also re-orientating the crane to further increase the distance of surcharge to the crest (This required a new crane lift study as boom ranges would increase; this was completed for contingency and outrigger stresses increased from 144Kpa to a maximum of 170Kpa).
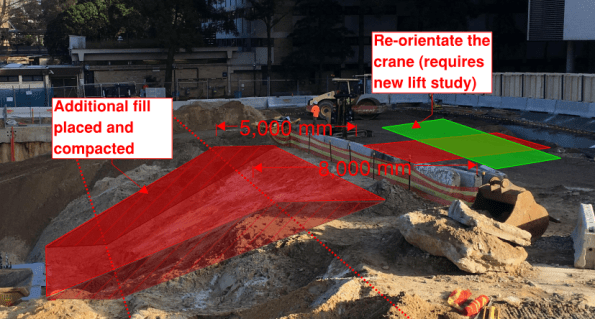
Figure 4 – Potential solutions on a mark-up.
Solution 1 Calculations – Build up slope with fill only (FAIL).
Solution 2 Calculations – Build up slope with fill and re-orientate the crane (PASS –JUST).
My results showed that the crane would need to be re-orientated and additional fill would need to be placed to increase the distance between the surcharge load and the crest of the slope. Mindful of the fact that my hand calculations may not be entirely accurate, I also checked on GEO5. Results are shown below, generating similar results for the current profile but passing on both solutions (only just passing for solution 2).

Based on these calculations I would suggest that the distance from the crest of the slope to the outriggers needs to be increased by placing some additional fill and by re-orientating the crane. The lifting will also need to be monitored very closely to ensure that loading conditions don’t increase (i.e. lifting study boom ranges are not exceeded) and the outrigger plates are the correct sizes. It will be interesting to see what the Geotechnical engineer comes up with tomorrow.
Down hole testing – Tentative geo based post…!
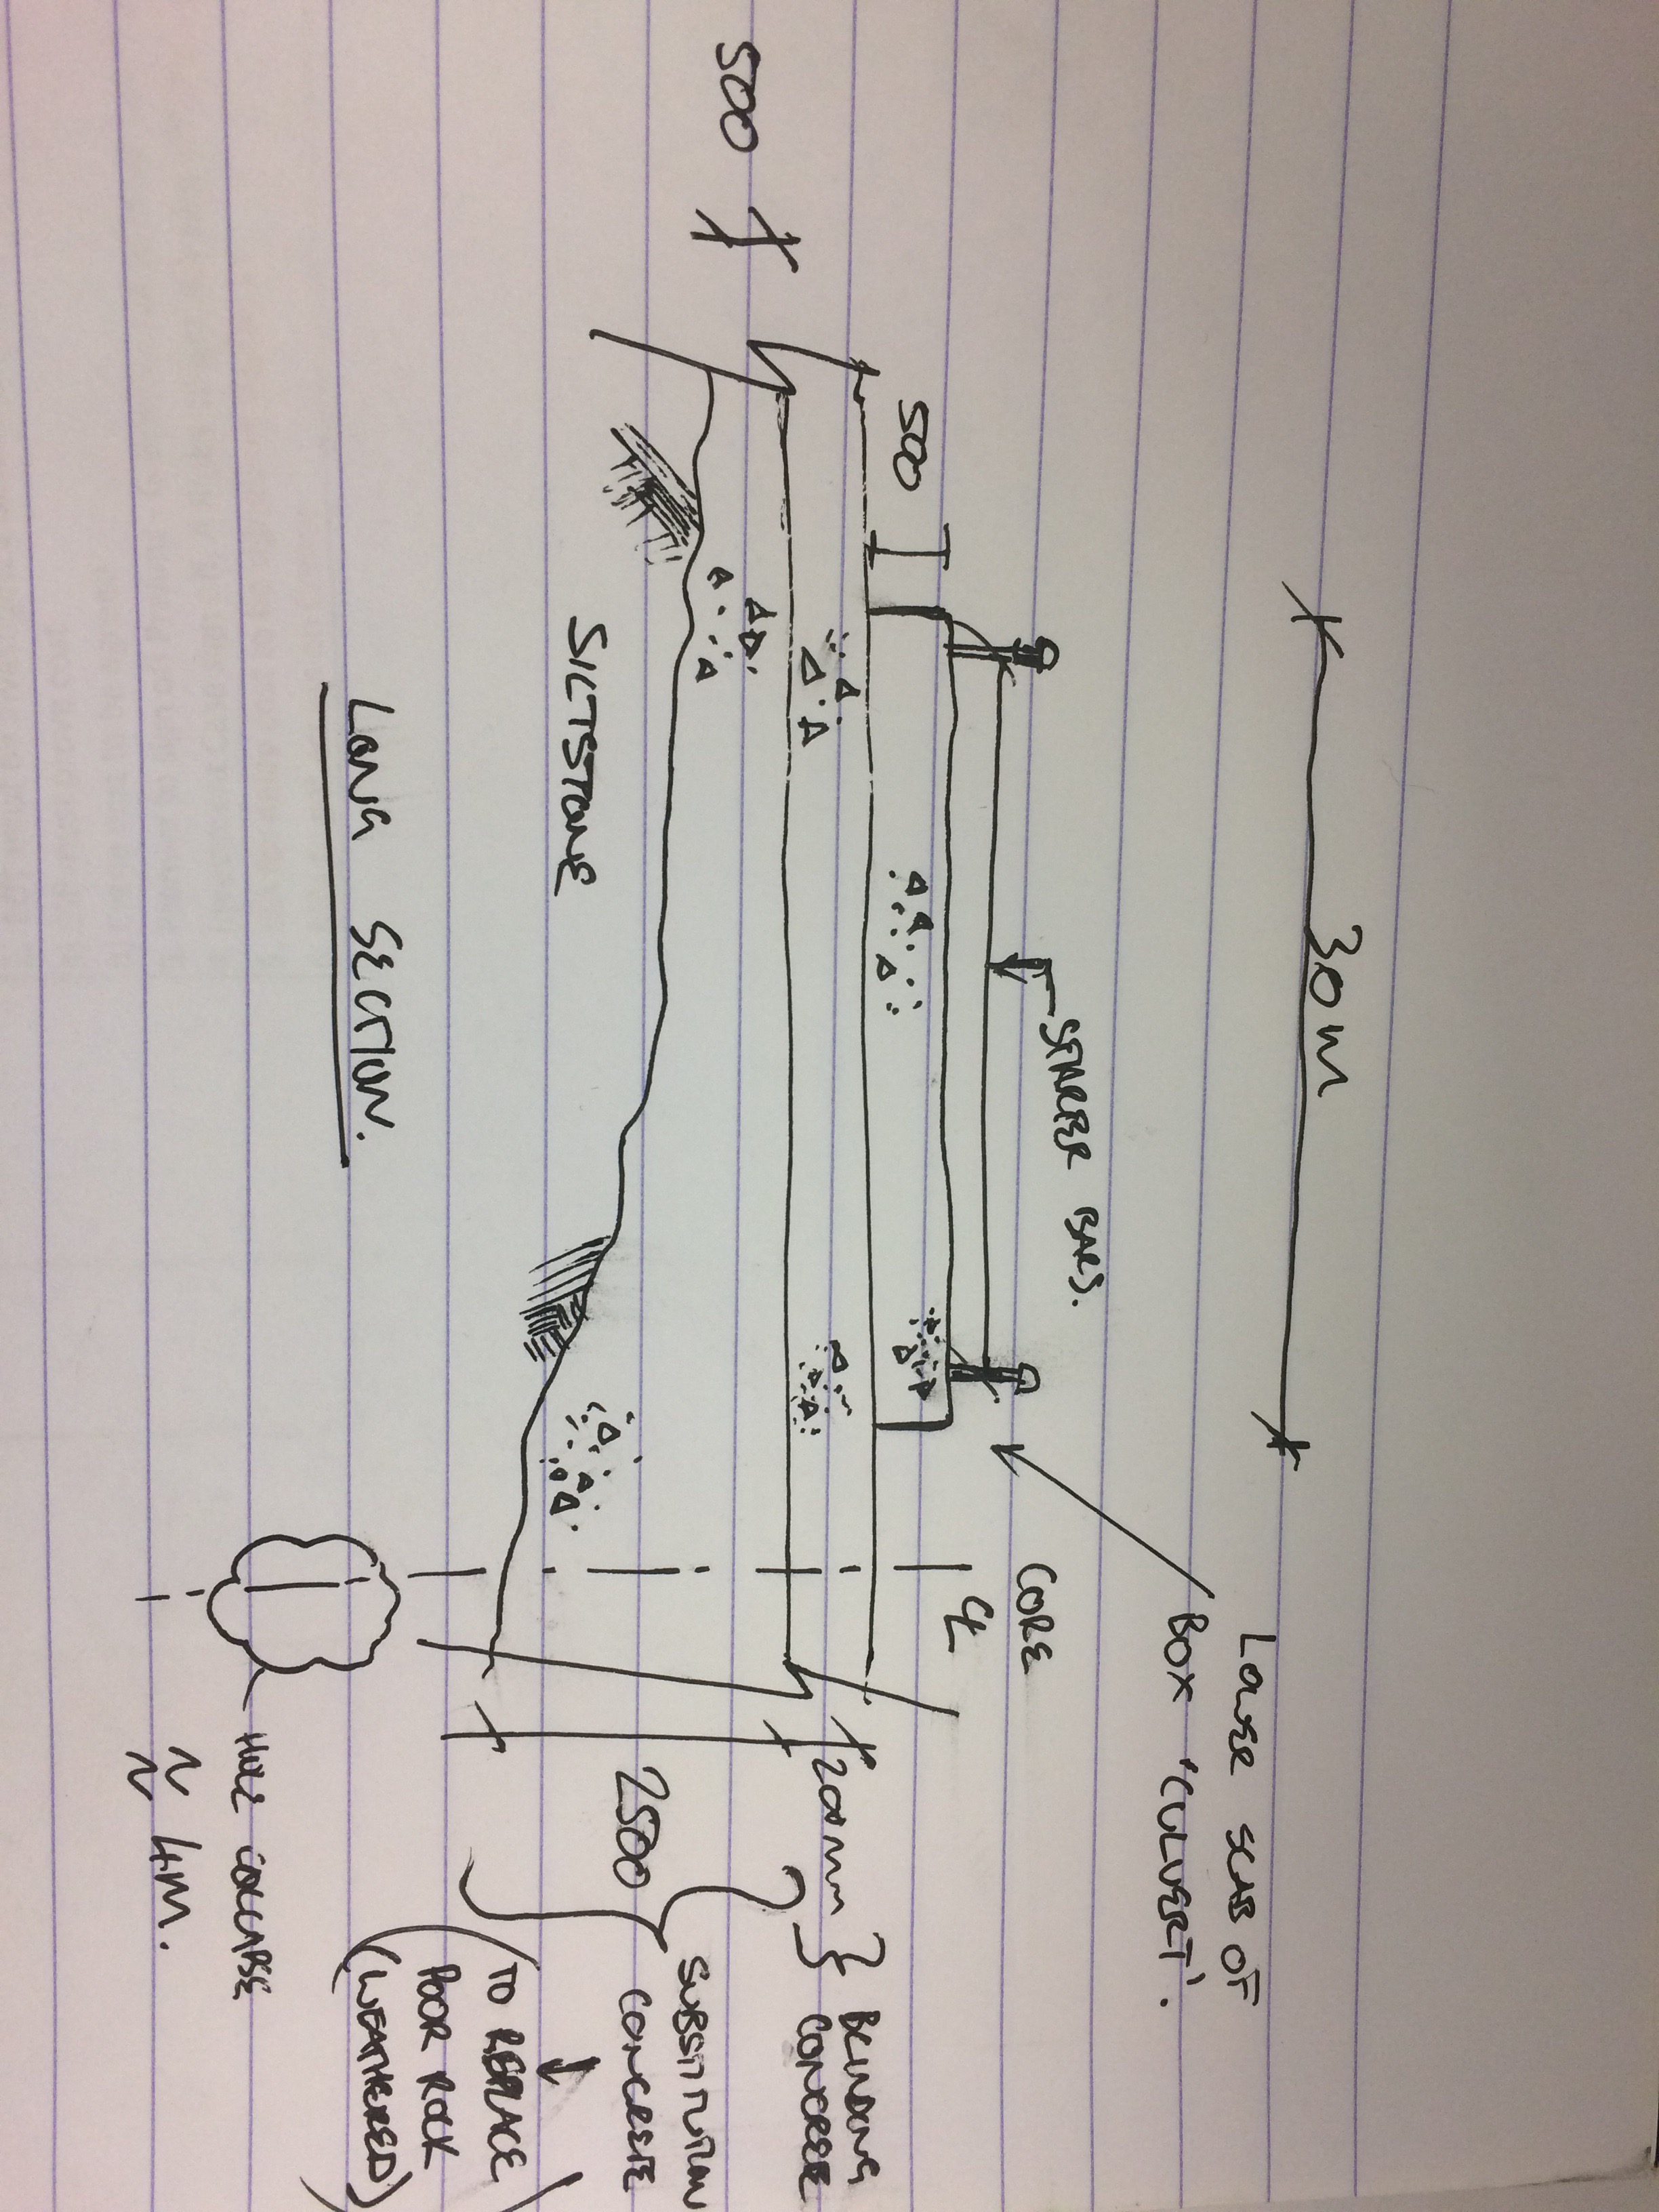
I’ve been told to oversee the use of a Menard test to validate the formation of some substitution concrete that was poured in almost submerged conditions. I.e water was being chased out of the 30m x 15m x 2m excavation by the concrete. Testing came about as the regulatory body was not best pleased about the whole thing.
Menard tests give a horizontal total stress to allow the eventual shear strength to be calculated. The picture is of the Menard assembly that is placed down the hole and expanded with gas and water in two separate membranes to give a pressure. This is repeated at different depths, normally from deepest to shallowest.
Issues are as follows:
1. They are struggling to keep the hole open to get the required membrane Volume for the test to be valid. About 60cm3.
2. They are trialling the use of a polymer in varying quantities (pure bore I think) But the polymer is too viscous and the pump pressure is getting too high. Possibly due to the trial area being on rock that is better than the siltstone which the real test was specified for.
3. The whole thing is becoming time critical as it is the second go we have had at it.
Could an SPT test give a similar result? Or is it too crude?
The use of Menard was a method specification given by the principal contractor geotechnical engineer. So the risk is ours.
Any thoughts would be appreciated.
Health & Safety: Australian Style
I’m back!
This being my second post/blog thingy, I thought that I would share with you all my love for Site Safety in the form of some snippets from my Health & Safety Journal – yes, I really do have one! As always with Supervision: It is good to trust, but better to check…
Feel free to exchange your own photos’ with me in the Comments Section. For now, here you have it, my top 5 spots to-date on-site: (In no particular order.)
The Waste Bin

Poor Sign Husbandry

Eye Protection…What is That?

If in doubt, MacGyver it!

And…Yes! This happened.

It goes without staying; I am making lots of friends on-site.
Industry Lessons Learned?
I received the following document (Dated April 16) this morning. At this early stage there is nothing to prove (That I have heard) the recent tragic accident is related to the issues outlined in this report. That aside, in the continued interest of professional competence and safety going forward its definitely worth a quick read.

Foundations in congested ground
EXP-487-SK002 – In ground services clash review BH responses TS markupI’m looking at the foundations for a new elevated walkway at Wembley Stadium. The ground is pretty congested with services thanks to those pesky M&E critters. Needless to say the SSPs are saying it’s absolutely impossible for them to abandon or move anything so i’ve got to bridge over them. Anyone got any references for good guidance on these issues?
Update following RFs comments:
This is just conceptual considerations however, linked
(randomly inserted at the top of the page) is the latest of the clashes discussions I’ve been having with the services coordinator. My current aim is to work out if the foundations are achievable, meaning identify the types of problems we have (eccentrically loaded pile caps, services under pile caps, services adjacent to piles/caps) and say what the possible solutions might look like.
Construction – has it really changed?
Most of my time with RPS Consultancy has been spent analysing existing historic dock structures. I have been working on a design and build project to construct new infrastructure for the Royal Navy’s new frigates in Glasgow. In order to make alterations to the dock structure it is necessary to understand how the existing structure works. As a result, I have spent a great deal of time trawling through old literature sourcing information.
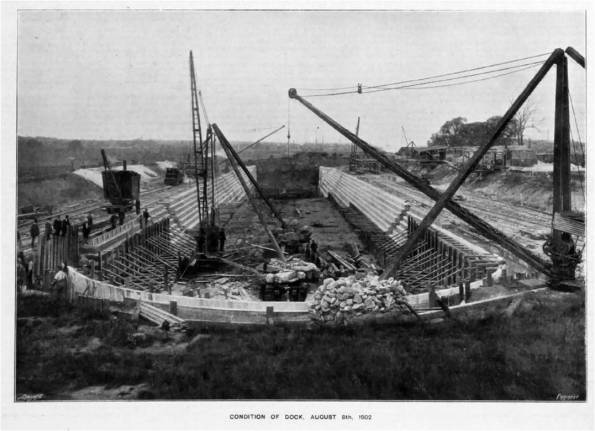
Recently, I found the following photos of the construction of a dry dock in Scotstoun in 1903. It occurred to me that, whilst there is no hi-viz and no fall protection, very little has changed in the world of construction.
Coincidently, my principal take-away from this analysis is that modern design codes are overly conservative. According to Eurocodes these docks should not be standing.
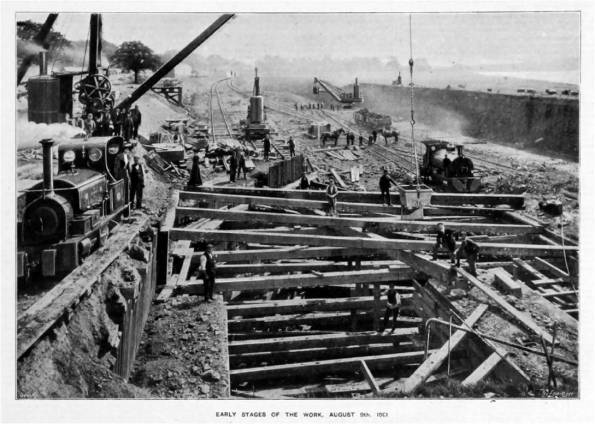
Dry Dock 1 – 1903
 Dry Dock 1 – 1903
Stabilising Continuous Flight Auger Pile Excavations with Compressed Air
A commonly used piling method in Australia is continuous flight augering, with an experienced operator it can be relatively simple to install, cost effective, with limited noise and vibration.
The interesting aspect of CFA piling by AVO is their use of compressed air to stabilise the excavation. Avo use a Bauer BG 24 rig, which has the ability to inject compressed air from the tip of the auger. Compressed air is injected near the discharge pump at 150kPa increasing by 100kPa for every 10m of depth. The pressure helps maintain the stability of the excavation prior to concrete being introduced through the stem of the auger.
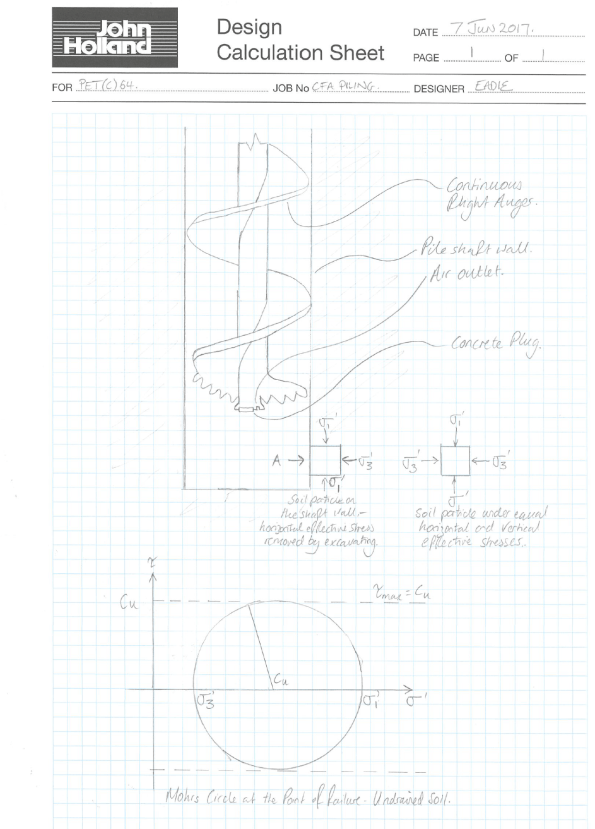
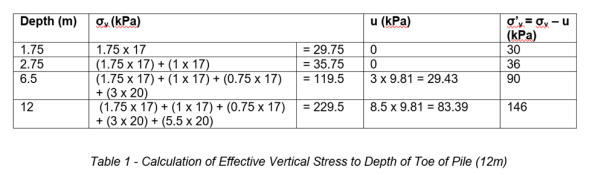
As the soil is excavated from the pile shaft, the horizontal effective stress (σ’3) on a soil particle on the shaft wall reduces to zero. The air pressure applies an equalising horizontal force to the walls of the excavation of about 250kPa, this is larger than the 146kPa which is being exerted by the soil around the shaft near the toe (see table 1). The air pressure helps stabilise the excavation from collapsing by applying a passive force against the active force from the soil around the shaft walls. Excess pressure is forced up the shaft helping lift soil up the flights of the auger.
This method helps increases the pile skin resistance by limiting voids along the pile shaft.
How quick is base heave?
Battersea Station Box is a top down method of construction; we are currently excavating in London clay and blinding in order to fix steel prior to pouring concrete for the propping structure. The first blinding was poured about 4 weeks ago and what at first we thought were surveying inaccuracies appears to be the concrete blinding heaving. We have excavated about 10m of soil so the total stress will have reduced by about 200kPa.
I believe there are two forms of heave, elastic rebound and swelling. The maximum rise in the blinding is currently about 10mm, and we are now trying to track the rise as it appears to moving about 2-3 mm a week. I am surprised that this is happening over such a short time frame and as we are casting primary beams prior to digging down again we risk the soffits being out of tolerance.
Currently all I can surmise is over such a short time frame it is elastic rebound rather than swelling. Swelling is due to changing effective stress due to unloading and the change in pore water pressure which I would have thought would take place over a longer period.
The GDR only quantifies heave in relation to pile design and the pressure it will apply to the base slab in the long term (drained), it mentions short term relaxation but does not quantify it.
Has anyone come across a similar situation before?
Freds Giant Crane
I acknowledge that my last blog bored most of us to tears, so this Friday afternoon just before the office beer fridge gets cracked open for the weekend I thought I’d follow it up with a topic even the E&Ms might enjoy.
Hopefully some of you will remember Fred’s blog a few months back in which he essentially implied he had designed use of one of the worlds largest land based crane systems during a morning coffee break. I had the joy of visiting Freds crane earlier this week on CPD. It really is impressively large. See below some photos and a few basic stats I picked up whilst there.
Its currently supporting removal of very large reinforced concrete beams as part of the demolition job on the Earls Court Job. The demolition package alone, including this crane, has a contract value circa 28 million quid.
![IMG_5113[1]](https://pewpetblog.com/wp-content/uploads/2017/06/img_51131.jpg?w=595)
In its strongest configuration the Crane can lift 5000 tonne. On this project the greatest load they will lift is just under 1600 tonne.
The load is transferred to ground through steel pads onto a compacted earth foundation and generates a bearing stress of 0.28MPa.
![IMG_5111[1]](https://pewpetblog.com/wp-content/uploads/2017/06/img_51111.jpg?w=595)
Giant lifting tackle, required just to assemble the crane.
![IMG_5115[1]](https://pewpetblog.com/wp-content/uploads/2017/06/img_51151.jpg?w=595)
The crane moves when the grey hydraulic jacks drag the legs along the rail. The silver disks are Teflon pads which create a low friction channel. The gang genuinely lubricate these runners with washing up liquid before each move.
![IMG_5119[1]](https://pewpetblog.com/wp-content/uploads/2017/06/img_51191.jpg?w=595)
The crane has a maximum operational reach of around 130metres. At this range it can lift approximately 300 Tonnes. When you consider a standard tower crane can lift roughly 3-4 tonnes at a maximum reach of about 70m these are impressive stats.
All these fancy figures aside, for me the most impressive implication is that deciding to use this crane has saved the sub contractor, or so they say, 3 years on their demolition programme. I hope the person who actually came up with this plan got an appropriate bonus for his lightbulb moment!
Baggage System Failure at Gatwick
For those who may have missed the news on Fri 26 May 2017, (note civvi date structure) there was a significant failure of the baggage system at Gatwick Airport which made national news. I will also share with you how BA managed to significantly divert media attention away from the baggage failure by their ability to seriously curtail the duration of their customer’s holidays.
Well, let me start by saying that the baggage system failure was not my fault despite the early conclusions drawn by my peers. The aim of this Blog is, to set the record straight, to regain control of my reputation as a polished E&M engineer, to give you an insight into how an airport baggage system functions and what went wrong on that fateful day; known as Bag Friday.
OVERVIEW OF THE BAGGAGE HANDLING SYSTEM (SOUTH TERMINAL)
To be able to describe the baggage system failure it is appropriate to give you the reader an overview of the mechanics of the Baggage System employed at Gatwick.
Meet Martha in Figure 1, she is a shy Check-In technician who takes control of your baggage at the Bag Drop. The bag is weighed and a bar-code is attached to the bag before it starts its very own journey through a myriad of conveyors, scanners, sorters and physical abuse sustained from the baggage handlers. The bar-code contains a list of descriptors which identifies you to the bag, flight details, destination, weight (of the bag), flight times and so on.

Figure 1 . Check in desk and Martha.
Your personal details are derived from your passport and tickets which are communicated to various agencies both internal and external to the airport. Internally, an individual’s personal data is forwarded to the airline which will checks you onto their flight manifest and central database for use of tracking and marketing purposes. Externally, Customs and Excise are alerted to you checking out of the country; their database is linked to the Home Office and shared with annexing databases owned by UK security services (this is applicable to both manual and on-line check in). In short, if an individual is on a Home Office ‘Watch List’ then basically he/she will be interviewed at the airport as they pass through security.
Assuming you are not a terrorist, your baggage is permitted to enter the baggage system. The bag is currently at Level 1 (blue insecure) and the Baggage System (governed by an Oracle database) is expecting the bag to arrive at the first scan point to perform a ‘handshake’ with the baggage. The scan is a function performed by an Automated Tag Reader (ATR) – the four blue boxes elevated above the conveyor shown at Figure 2. No matter where the tag is positioned on the bag and however the bag is oriented on the belt, the ATR can locate, read, and decode the bar-code achieving up to 99.8% read rates even for damaged or poorly printed codes. If the tag is unreadable, an operator removes the bag from the conveyor and then manually codes the bag into the Oracle Database and reintroduces it to the conveyor.

Figure 2. 4No Automated Tag Readers elevated above the inbound conveyor.
The ATR also scans the orientation and size of the bag, from this point forward the bag will be physically rejected from the baggage system if it has moved over a tolerance of 20mm on the assumption it has been compromised. For efficiency, conveyors default to idle when not in use and also the speed of conveyance is governed by Programmable Logic Controllers (PLCs). Each of the conveyors have a dedicated PLC gate which notifies the next PLC and so on to guide the bag through the conveyor system. The PLCs also feed data to the central Oracle database which tracks the bag’s progression through the baggage system.
The next step is to scan the baggage for illicit material. The Level 1/2 scanners perform an automated check in under 3 seconds and if satisfied with the contents, the bag is permitted to progress onto the next stage. The level 1/2 scanner is shown below in Figure 3; note the Level 1 blue conveyor presents the bag to the scanner and emerges on to the red (scanned) conveyor on the far side.

Figure 3. Baggage Scanner detects illicit material within the baggage.
The bag is passed to a vertical sorter (a decision point) as shown in Figure 4. The bag is either permitted to progress onto the next stage or a PLC command will force a transfer to Level 3. At Level 3, an operator has 15 seconds to check the bag on their screen and if the operator is unhappy with the contents, the passenger is summoned to open the bag for a Level 4 manual search.

Figure 4. The vertical sorter allocates the bag to either Level 2 or 3 conveyors
Assuming the bag has successfully cleared level 2, the bag is allocated to a tip tray conveyor as shown in Figure 5. PLC logic controls the speed of a delivery conveyor to ensure the bag’s approach is synchronised with the tip tray. The chutes also shown in Figure 5 are dedicated to particular aircraft, when the bag arrives at the appropriate chute it drops down to a Make Up Position where a baggage handler loads the dolly (bag truck).
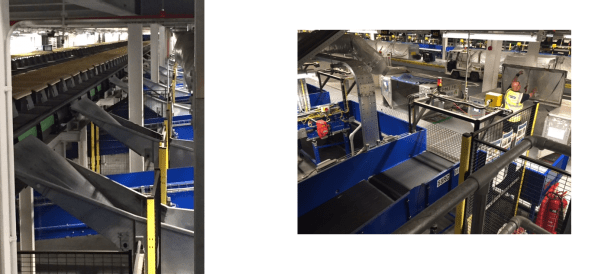 Figure 5. To the left is an image of the Tip Trays and Chutes. To the right is an image of the Make Up Positions
SO WHAT WENT WRONG ON BAG FRIDAY?
To understand the error you need to understand how a baggage Oracle database works. The central Oracle database manages the automation of the baggage system which is fed data from a vast array of PLCs distributed across the baggage network. The database stores the data into tables which dynamically increase/decrease in size in relation to the amount of data accrued by the system. The data tables are called ‘Stacks’ and have a limited capacity before they start to overflow and discard data.
A bespoke programme queries the Oracle database and presents the baggage system performance characteristics to the Building Management System (BMS). BMS is a Graphical User Interface which can manually or autonomously manipulate mechanical systems around the airport, such as the baggage system and also the air conditioning.
The communication path between the Oracle database and PLCs contributed to Bag Friday. The PLCs fed data to the Oracle Database, however due to latency issues in the communications network, the database was receiving data spikes causing the Stacks to increase in size beyond their maximum capacity. The Oracle Database became overwhelmed and gave a stop command to the PLCs which in turn closed down the baggage system.
As a consequence, within 7 mins of failure the Check-In desks were closed and puts the airport on alert status ‘Bronze’. At 45 mins the Arrivals and Departures fills up with passengers which heightened the alert status to ‘Silver’, at 90 mins cars on the M23 and M25 were backed up and Gatwick hit the headlines. The baggage system was down for just under 3 hours resulting in a total of circa 3000 bags remaining in the terminal, later repatriated with their owners at a cost of approx. £150 per bag.
WHAT HAPPENED TO BRITISH AIRWAYS?
BA tweeted to the media that they have a data HUB near Heathrow that lost power; one would suggest they should have factored redundancy into their power supply if indeed this was the case. According to a senior BA rep at Gatwick, the actual reason for the their system to collapse is because they sold their operating system to India to reduce costs! BA operate on a Virtual Local Area Network (VLAN) which allows their operating system to be placed anywhere in the world. Situating an entire Operating System on a VLAN is a sound concept and common place for many multinational companies, however in the case of the BA system failure, the link from OS in India to the satellite ‘dropped out’ to the Master/Slave servers. The failure caused their entire management system to collapse, grounding all aircraft, ceasing all bookings, aircraft tracking and configuration of flight manifests. The entire fleet had to re-set to a start state two days out from the time the failure occurred.
In summary, the issue with BA overshadowed the Baggage failure at Gatwick, therefore we owe BA a great debt of gratitude.
