Flows and Loads
E&M’s will remember the tricky task on our first project of trying to guess the population for a deployment before being able to even think of starting our Water and Wastewater calculations. Gatwick currently has me looking over two sets of educated guesswork on a similar but altogether different issue. How do you estimate the population of a corridor?
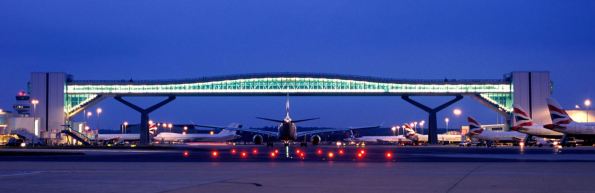
Background. The corridor in question is the bridge or “Pier Connector” that connects North Terminal Pier 4 to Pier 6 through which passengers for all arrivals and departures for the ten Easyjet A320’s and one Emirates A380 that regularly park there currently walk. The business interest in this question is checking that, when Pier 6 grows to accommodate another seven aircraft, the occupancy of the Pier Connector will not increase beyond the design occupancy necessitating consequential improvements to the building services. The first task here was trying to find the original design occupancy, the second to compare this with current real occupancy and the third to compare it with predicted future occupancy.

Record Retrieval. Having found the Nov 2001 ARUP report “Estimated Passenger Flows across the Pier Connector” buried deep (page 2954!) in an annex to an appendix to the steel superstructure portion of part C of the Pier 6 health and safety file passed to Gatwick Airport Limited (GAL) by the British Airport Authority (BAA) back in 2009, it appeared that the original occupancy had been worked out in two ways. Firstly for emergency loading such as the evacuation of Pier 6 to Pier 4 across the pier Connector and secondly normal loading for scheduled flights.
Escalator Flow Rates. Emergency loading had been done by using the speed of the escalators at either end of the bridge to give a passenger flow rate onto the bridge. This and an estimate of walking speed based on crowd density allowed a fairly simple calculation of the maximum number of people who could be put on escalators and across the bridge. It also produced a figure of five minutes for a reasonable estimate of how long it should take to cross from the bottom of one escalator to the bottom of the other side. Incidentally, bored of sitting at a desk looking through old files, I took a stopwatch to the bridge and found that, while it can take as long as 5 minutes and 20 seconds to cross, most people seem to make it over much faster.
Five Minute Elements. This five-minute figure formed the basis of the calculation for normal loading along with a future schedule for arriving and departing planes. A bunch of assumptions concerning how early people go to the gate for a flight and how long it takes to empty a plane, and some more basic calculations cutting these time periods into five minute chunks and distributing passenger loads for each aircraft across them, led ARUP to a pair of graphs that with the handy WebPlotDigitiser, thanks to MH for the pointer and Ankit Rohatgi for the tool, I was able to combine into the below figure.
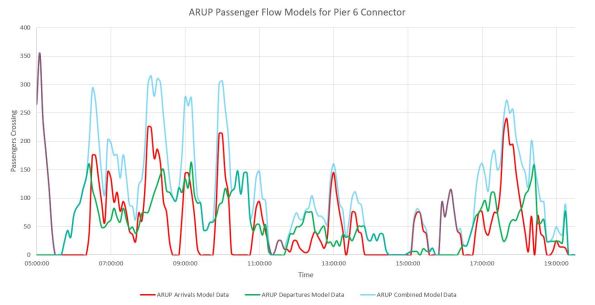
Overlap Oversight. Interestingly, and significantly if you read to the end, the ARUP report didn’t go that stage further and look at how arrivals and departures peak loadings interacted. They took the arrivals maximum of 363 and the departures maximum of 166 to give a maximum expected occupancy of 529. Had they combined their data sets they would have seen instead a lower maximum of 363. But how does that compare with expected future loading?
P+W = ? The designers of the Pier 6 Western extension, Pascall+Watson, had concerns over crowding in the arrivals corridor at the base of the escalators up to the bridge and also over the occupancy of Pier 6 departures lounges and gate rooms. In order to answer these issues they ran some computational fluid dynamics software on the arrivals flow and did a similar Excel based calculation to the ARUP “five-minute elements” on the departures flow. Using this data, with some minor tweaks to the arrivals flows to correct for how they had been counted, produced the below figure. The arrivals data needed tweaking as it did not count passengers on the escalators but only on the bridge deck. This also led to an unusual imbalance in the figures for total arrivals and total departures.
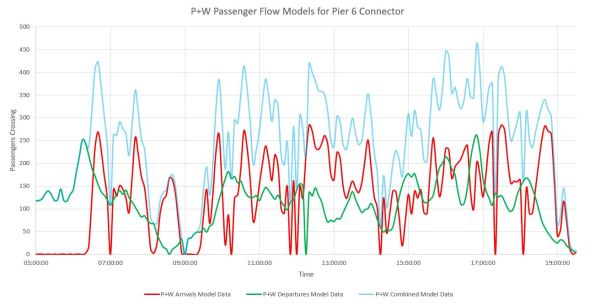
Overlap Insight. Here the importance of looking at how the flows overlap is once again highlighted. Taking separate maxima, of 284 arriving and 262 departing passengers, would see the bridge exceeding the design occupancy of 529 passengers. However combining the data sets gives a maximum of 463 passengers which due to the earlier ARUP oversight falls within the design occupancy.
Conclusion. My key take-aways from looking at this issue, :
- Q=VA for Humans. Conservation of mass/continuity is the obvious bit but correctly identifying the choke points approaching or leaving a circulation area, such as flow onto or off of aircraft or up escalators, and then developing the flow rates for these is the key point. After that the occupancy calculation is relatively simple.
- Overlaps. Once flows into and out of a space have been established it is important to look at how flows combine with one another.
- Visit and verify. I gained a lot from walking the ground with a stopwatch and sitting around counting and timing people. It not only allowed me to do some validation/verification of the ARUP and P+W models but also provided the insight needed to adjust the P+W arrivals data.

Good stuff!! All that time spent trying to fathom populations and the like wasn’t so futile was it?!!
Hi George
Thanks for an interesting blog, but where is the electrical input?