Home
> Uncategorized > A graphical post!
A graphical post!
Happy New Year to you all!
I wanted to share with you a useful tool I used in my last TMR and may be helpful with analysing secondary or tertiary data for Theses.
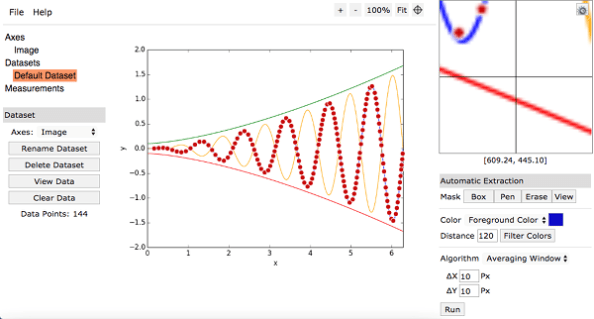
During Phase 1, the E&M course used Webplotdigitizer to take points from a graph in a pdf. This allows you to plot your own graph in Excel making it easier to analyse and manipulate data. For example, plot your own results against the secondary data in a comparison.
There are multiple tutorials on You tube, so I won’t bore you with a wordy explanation and screenshots of how to use it.
Enjoy!
Categories: Uncategorized

Cheers for the reminder – I’d ‘misplaced’ this tool since Mark showed it to us all the way back in Phase 1 and had reverted to drawing lines on PowerPoint and rough-guessing!
Nice one! That will be useful – cheers.
Nice one mate, that is very useful.
Same as Dave, thank you!