Archive
Think twice before paying for an ‘expert opinion’
This is just a short post but I thought it was interesting.
Whilst researching into UXOs and the effectiveness of qualitative vs quantitive risk assessments I came across an interesting study. In the study the researchers asked 25 experts in the UXO industry to make a series of risk assessments, typically based on the probability of a UXO detonating in certain scenarios (e.g. striking a UXO with the back hoe of an excavator or being played with by children).
The study essentially concluded that when you pay an expert for their opinion, at least in this field, you might as well not bother. The figure below shows the results of part of the study where each fitted cumulative distribution function (CDF) represents the assessed probability of a UXO detonating by a different expert. The report summarises that “In three of the six scenarios, the divergence was so great that the average of all the expert probability distributions was statistically indistinguishable from a uniform (0, 1) distribution—suggesting that the sum of expert opinion provides no information at all about the explosion risk.”. This basically means that the average of their results said the probability of explosion was equally likely to be 0% as it was 100% (with a low confidence interval), not necessarily very useful information! My initial thoughts are that where data can be acquired, assessments should be made quantitively where possible.
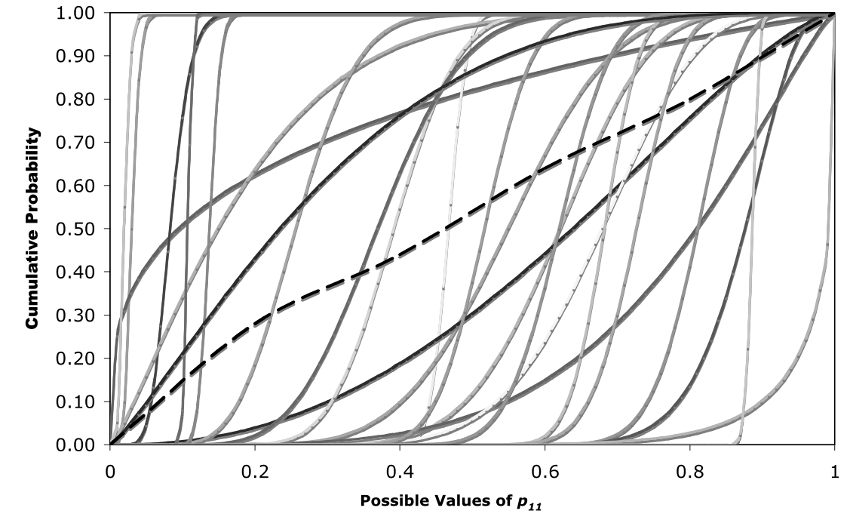
The solid curves are the CDFs of the individual experts, and the dashed curve represents the CDF of the mean explosion probabilities estimated by the experts. The horizontal axis indicates the probability of explosion. The vertical axis represents the cumulative probability that the chance of explosion is less than or equal to the corresponding horizontal axis value.
The full report can be accessed here: https://onlinelibrary.wiley.com/doi/abs/10.1111/j.1539-6924.2008.01068.x
Piling in
My project is a road widening in Sydney that requires a number of road signs. There are a significant number of small signs and three large ones which require piles. A number of sub-contractors tendered for elements of the work earlier this year but only one submitted a tender which included both the signs and piles. This was the deciding factor in the decision and the contract was awarded to them for approx. $500k.

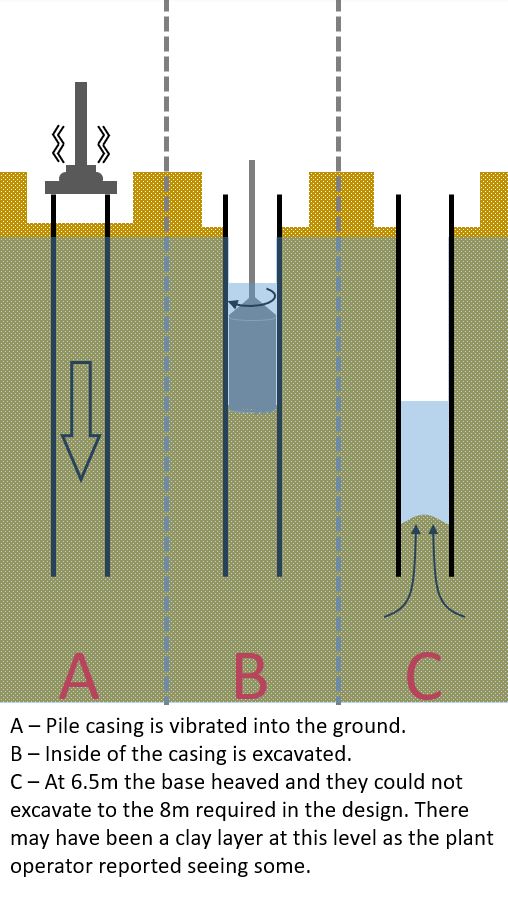
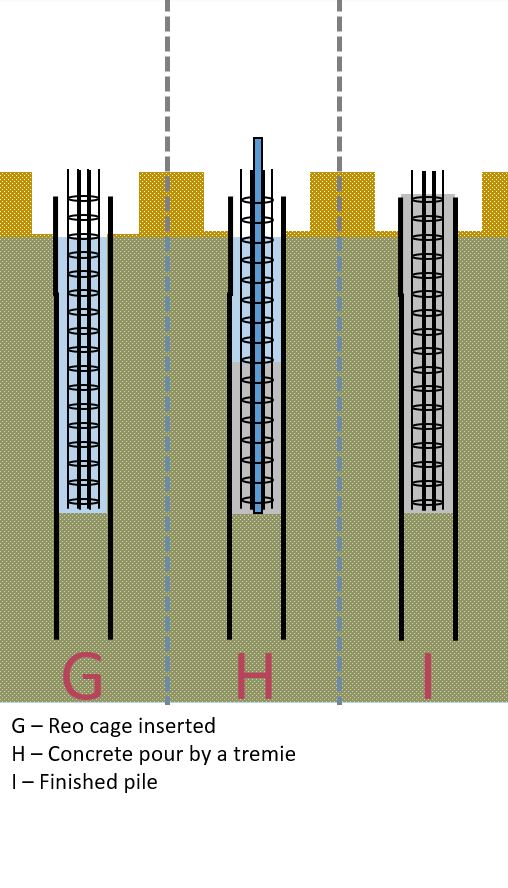
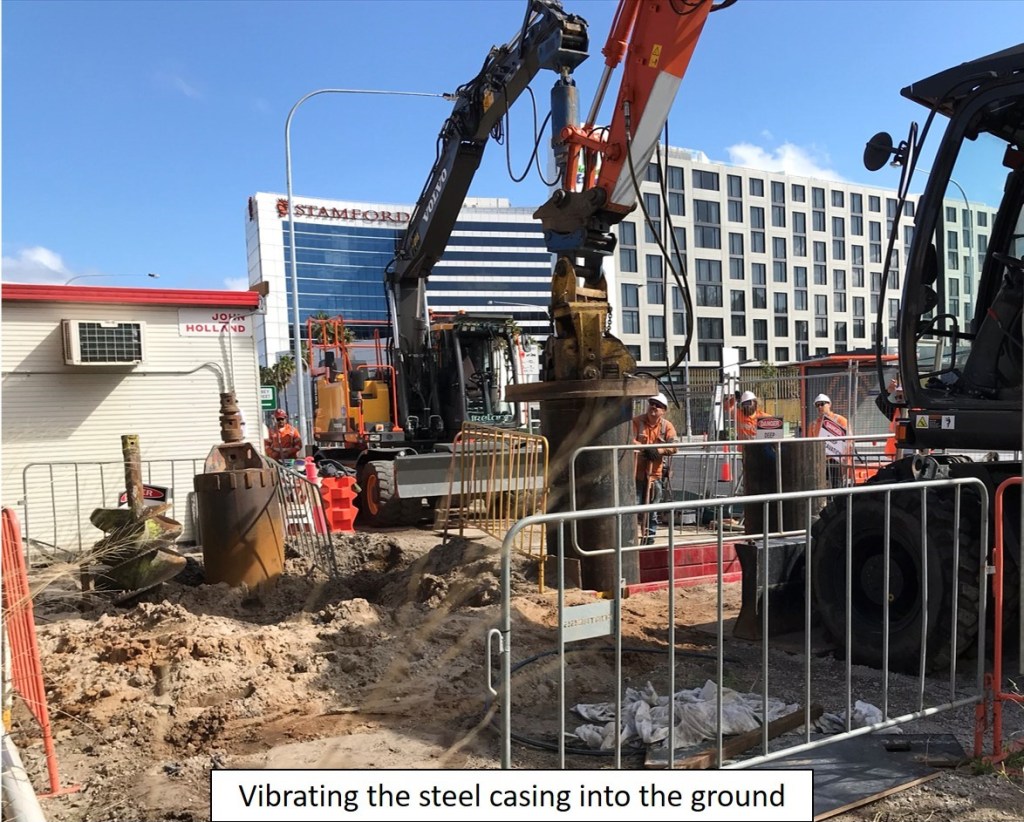
The sub-contractor selected is a sign structures specialist and they sub-contracted the piling work. As there are only a small number of piles they decided against CFA piles and instead opted to use a permanent casing, bore the piles and use a tremie to pour the concrete. The rational for this, I believe, was that the savings made in plant mobilisation outweighed the cost of the lost casing. The ground is medium to dense sand with a couple of clay layers with ground water a couple of meters below ground level.
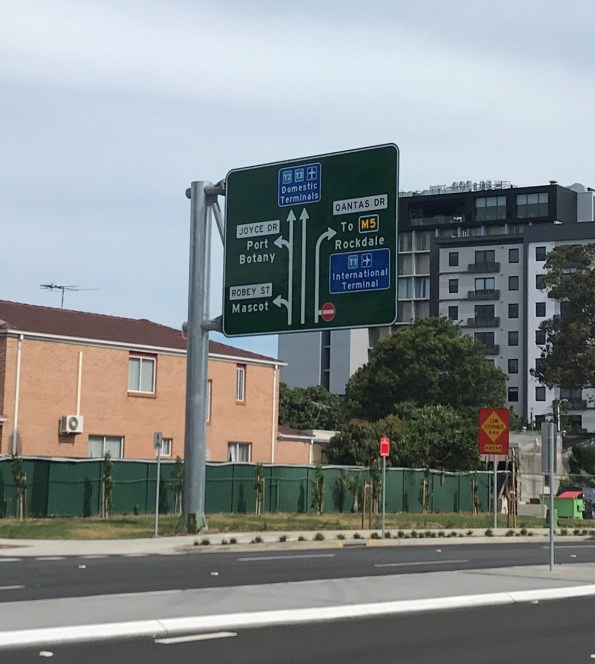
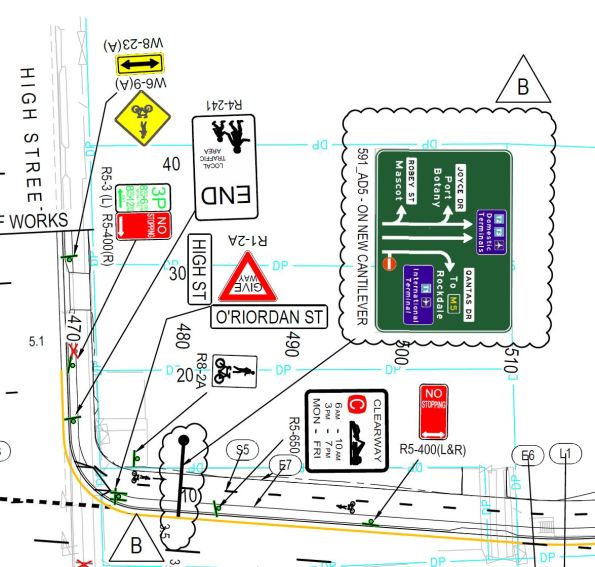
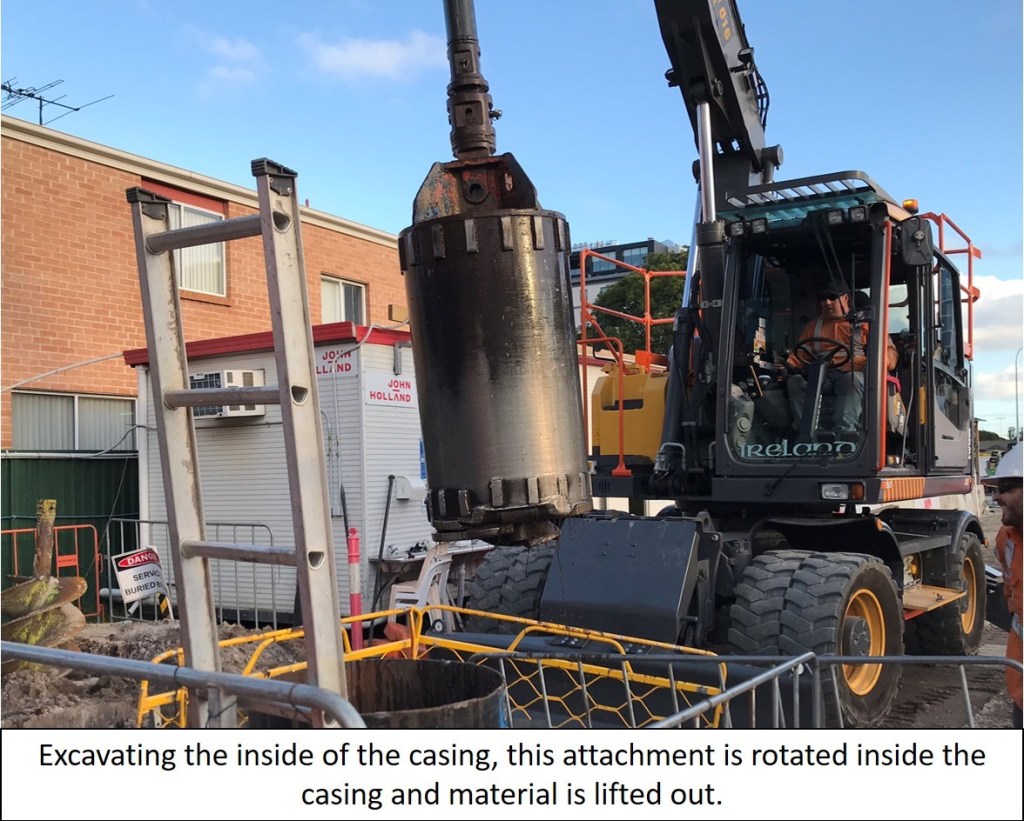
When piling for one of the signs (shown in the photo) the sub-contractor was unable to excavate to the design depth. What happened and photos are shown below:
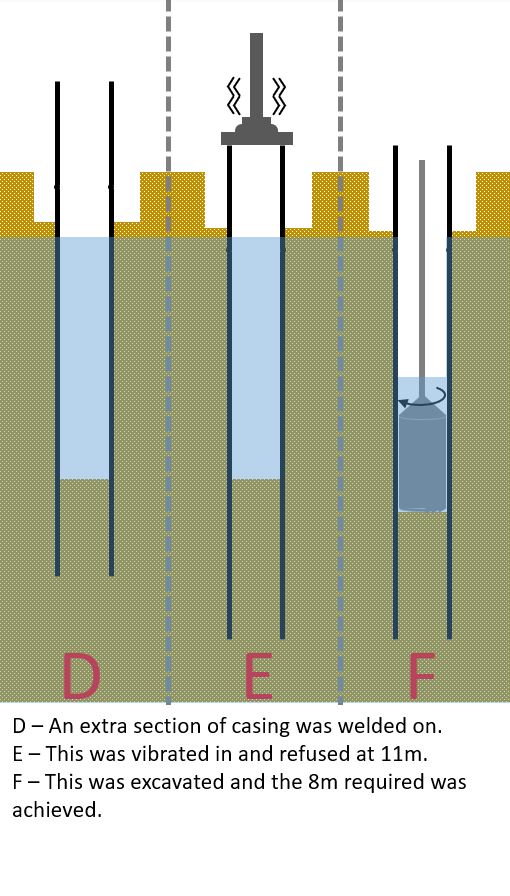

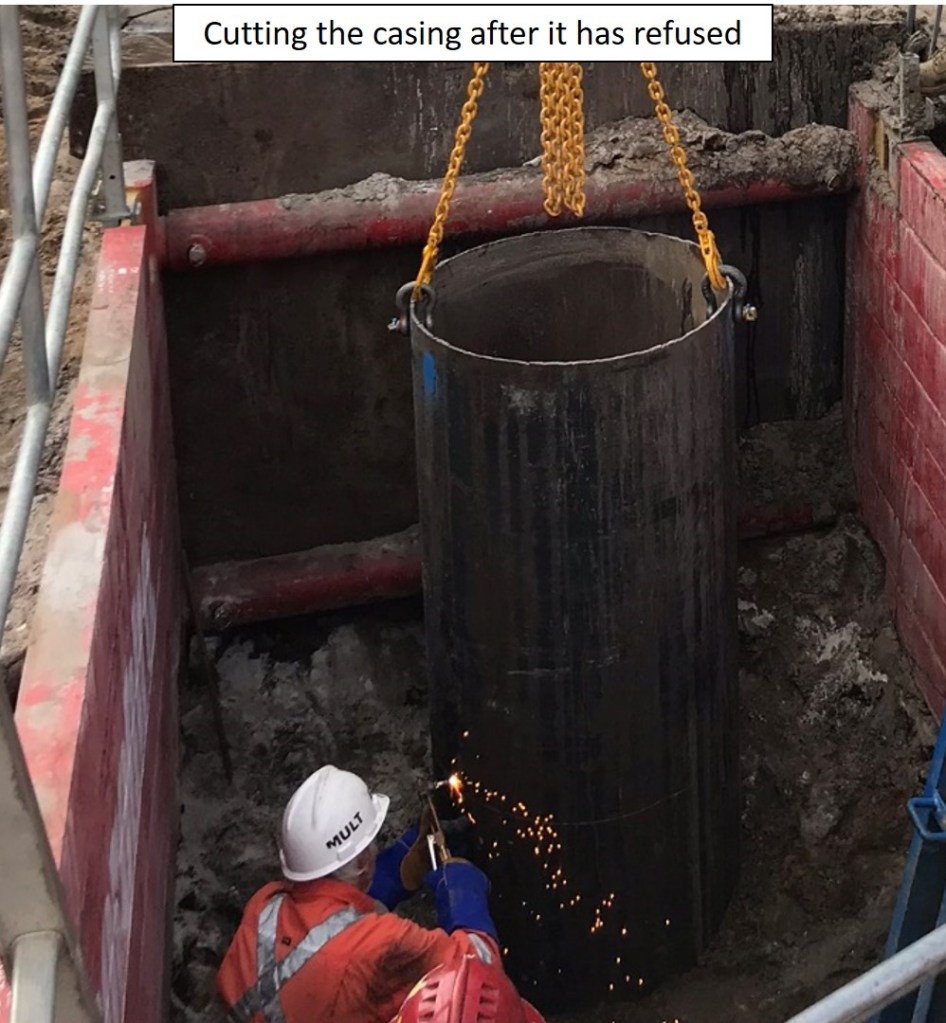


When the first excavation could not reach the depth required the sub-contractor claimed it was unknown ground conditions and wanted to put in a claim. Looking at the contract they had taken on this risk. However, as these signs are on the critical path and John Holland wants to complete this job as quickly as possible the sub-contractor was instructed to proceed. Discussing this with the contracts manager his take is that John Holland will probably end up paying some of the extra costs as they are very small ($3-5k) in relation to delay costs to the project.
We (John Holland) ended up having to supervise all the piling works as the sub-contractor was unable to. Most of these costs were back charged to the sub-contractor. The general feeling in the project team is that if they were to do this again a specialist piling company would have been selected.
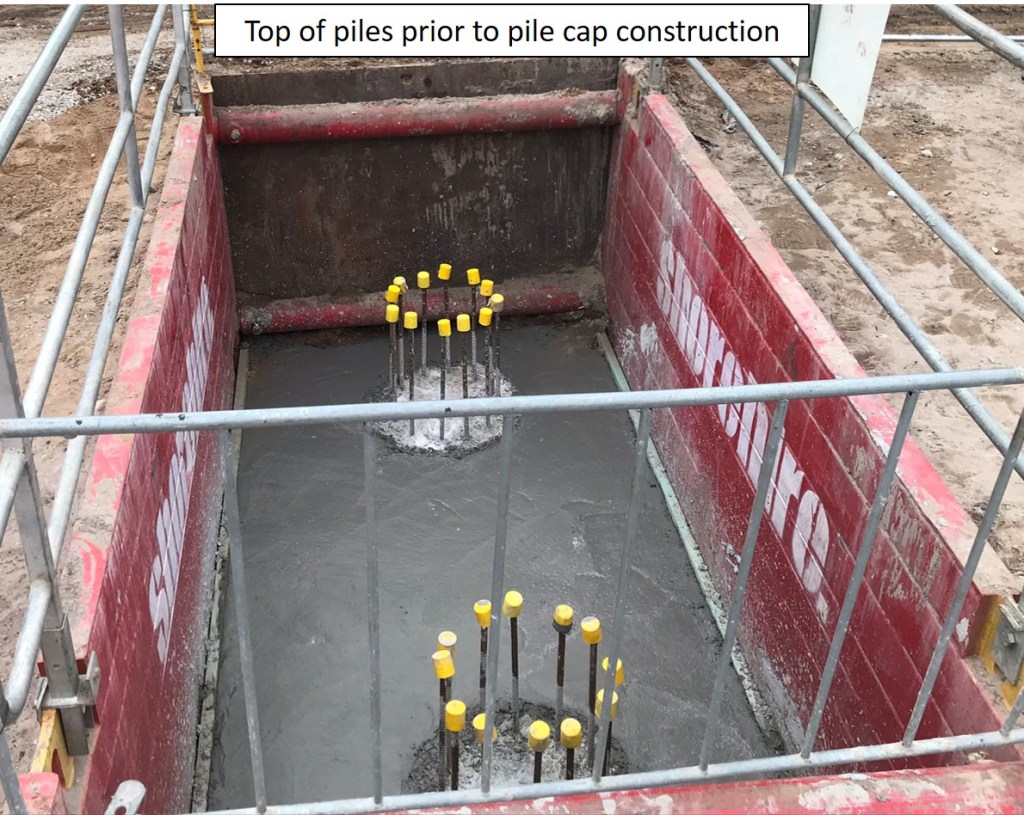
I estimate that the horizontal loads on these piles area around 4 times larger than the vertical loads. What has been built in my opinion is significantly over engineered as:
- The pile casings are now 35% deeper.
- The ground conditions are far more favourable than the medium dense sand allowed for in the design.
I feel that when the pile could not be excavated to the design depth there may have been an opportunity to get a revised design approved with a deeper pile casing and shallower concrete infill. However, the focus is on constructing as per the client’s design and getting this design approved would have taken far longer than just getting the sub-contractor to continue and project delays costs were far more significant.
Using polystyrene as a structural filler replacement
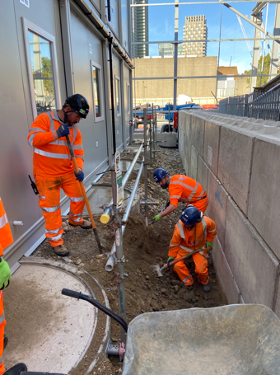
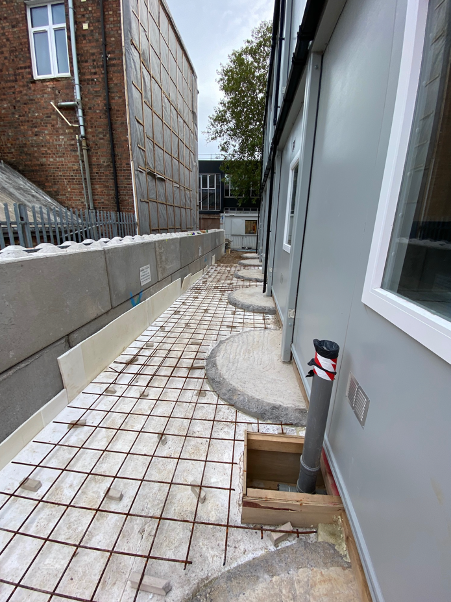
Recently I’ve finished the installation of a welfare facility for a package of works I’m currently managing. One of the few outstanding tasks was to pour a very simple 100mm concrete footpath with a bit of of A193 mesh in the middle for cracking protection. The footpath was to surround the perimeter of the welfare facility.
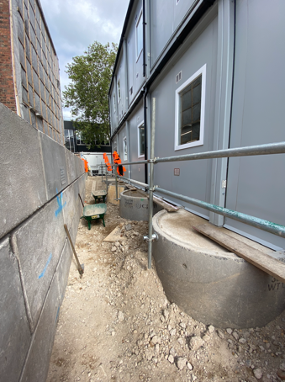
However shortly after installation, the temporary works team contacted me to say that their calculations for the welfare platform had been Category 3 checked (the highest level of check, conducted when there is a high risk to a third-party asset) and had failed. It failed on the basis that the crush (6F2) platform on which the footpath was going to sit was exerting too much pressure on the adjacent cast iron Victorian London Underground vent shaft and could lead to a catastrophic failure. Consequently the temp works team said that the platform needed lowering along one side of the welfare facility (see diagram below – area to be lowered in blue.).
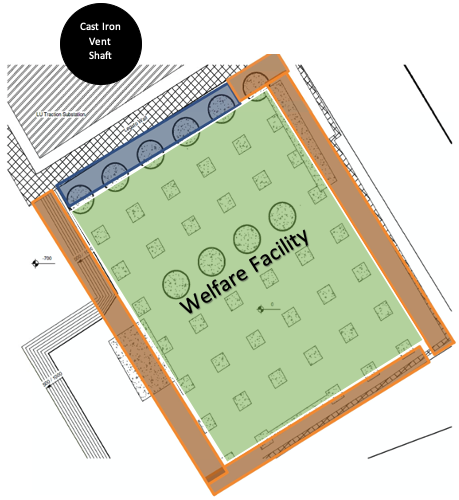
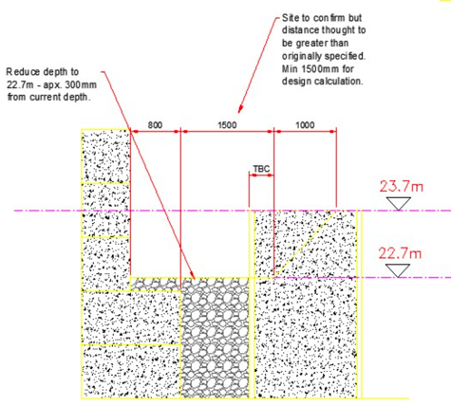
The platform needed lowering by about 1m over a 20m length to reduce the loading on the vent shaft – by removing 20m3 of 6F2 crush we would be able to reduce the loading on that area by about 48 tonnes. The sketch below shows the requirement to lower the platform from 23.700m to 22.700m.
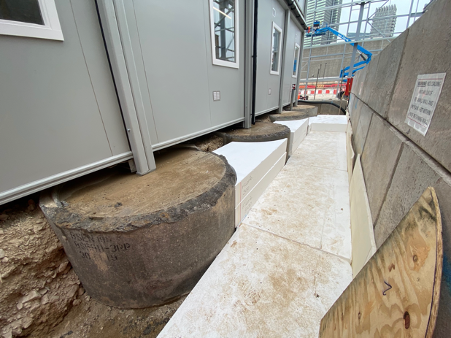
The photos below show the reduction of the welfare platform level.
Back to the footpath. I now had to install a footpath over a perimiter that over a 20m length had dropped by 1m. We considered 3 options:
- Build the platform back up to 23.700m with a scaffolding solution (not permanent enough and would be a burden for the weekly temp works checks).
- Drop the footpath down to 22.700m with either a concrete or Haki staircase (not DDA compliant and restricts maintenance to this north west side of the welfare facility).
- Build up the platform to 23.700m with a light weight material. (this is the option we selected).
The foreman mentioned that he’d seen polystyrene being used before as a lightweight filler and although no one else in my team had any experience with it, it was proposed as a solution to temporary works who signed off the design (see below).
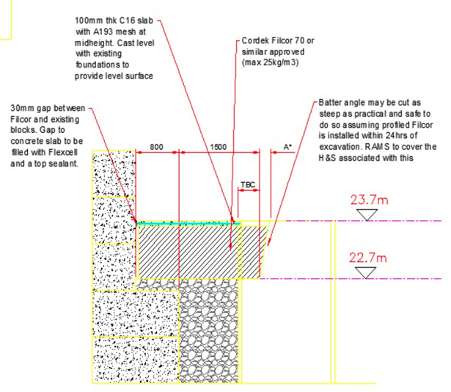
Filcor 70 is an expanded polystyrene with a density of 25kg/m3 and a compressive strength of 70kPa – plenty enough for us (although Filcor’s products go up to 190kPa, see link: https://cordek.com/products/filcor).
The photos below show the installation of the polystyrene followed by the concreting and finished footpath. I hadn’t heard of using polystyrene as a lightweight structural alternative so it might help people solve similar issues in the future – one to bear in mind.


Art of the Possible
I blogged a while back about the potential for dispensing with the need for generators by instead utilising the existing grid connected electrical infrastructure to power a winter environmental control solution for the ‘East Wing’ (Convective heaters and dehumidification units). The spare capacity in the infrastructure is due to the reduced footfall and activities on site a la COVID, with some quick analysis of the Building Management System data it was found that there would be sufficient capacity to provide most of the temporary heating electrical demand.
The cost of generators on hire and the fuel as well as the noise and the associated carbon footprint are undesirable given the cheaper and cleaner (carbon footprint per kWh, getting better and better) supply of elecricity from the grid.
Essentially the ‘East Wing’ has two zone distribution boards at the North and South end, both of these boards have 400 A three phase incoming supplies, therefore each distribution board can theoretically draw 276 kVa based on 400 A per phase loading with a phase to line voltage of 230 V. There are 6 floors to provide environmental control to with each floor having different loading requirements due to ‘high risk’ areas in terms of conservation etc.
We toyed with the idea of setting up a system whereby generators would be joined in parallel with the existing electrical infrastructure, the idea being you would maximise the grid capacity from the distribution boards and use generators to ‘top up’ any additional power requirements in the event of surplus demand. We were informed by contractors that to parallel generators up with the grid requires DNO (District Network Operator such as UKPN) permission, takes a long time and costs a fair amount of money (there is also no guarantee that the DNO will provide permission).
Therefore it was decided to match specific ‘high-use’ floors to the distribution boards which turned out to be the groundfloor, principal floor and second floor and the remaining floors would be supplied by dedicated generators. It has already been noted that the kVa demand of each floor has been based on no diversity i.e worst case scenario that all convective heaters and dehumidification units are turned on simultaneously. It has been confirmed that there are spare ways on the Medium Distribution Units to the three floors just mentioned which gives us flexibility if it becomes apparent that the diversity assumption is ‘overkill’ and we can extend the provision of grid power safely across more of the floors.
Also worth mentioning the ‘East Wing’ has been split into North and South zones for geographical convenience in terms of cabling and voltage drops from the zone distribution boards.
Potentially a blog post soon looking at the temperature and humidity levels in the building and the optimisation of the solution, just waiting on access to the environmental monitoring database (temperature and humidity sensors positioned across the floors).
The show must go on
Despite what we may have been reading in the newspapers regards various lockdowns across the Schengen zone and wider European continent, the airline industry has been limping on and where possible, facilitating both freight and passenger movements in and out of the UK mainland. The infographic below shows the total relative numbers of passengers moving through Heathrow. For sensitivity reasons absolute numbers have been removed however it still gives an idea of the relative reactions to local lockdowns. For reference, note the significant dates below in the table whilst watching the relative movement of each country. (Click replay at the bottom of infographic to do so).
| Date | 14 day quarantine lifted | 14 day quarantine imposed |
| 10 Jul | ESP, FRA, GRC, DEU | |
| 25 Jul | ESP | |
| 8 Aug | BEL | |
| 20 Aug | HRV, AUT, FRA, NLD | |
| 22 Aug | PRT | |
| 29 Aug | SWI, CZE |
Island-Building
I’m sure you’re all aware that within the last ten years, China has been building artificial islands in the disputed south China sea, but what you may not know is that the US has been doing this type of engineering since the 1990s. In the Chesapeake Bay, an artificial landmass called Poplar Island is nearing completion after 22 years of construction under the supervision of the US Army Corps Of Engineers (USACE). The island consists of over 1600 acres of uplands and wetlands and serves as an ecological sanctuary for flora and fauna within the Chesapeake Bay area. It ticks another sustainability box too, as it’s constructed using soil dredged from the bottom of the bay in the creation and maintenance of shipping lanes; soil which is often highly contaminated and therefore usually needs to be transported long distances for safe disposal.

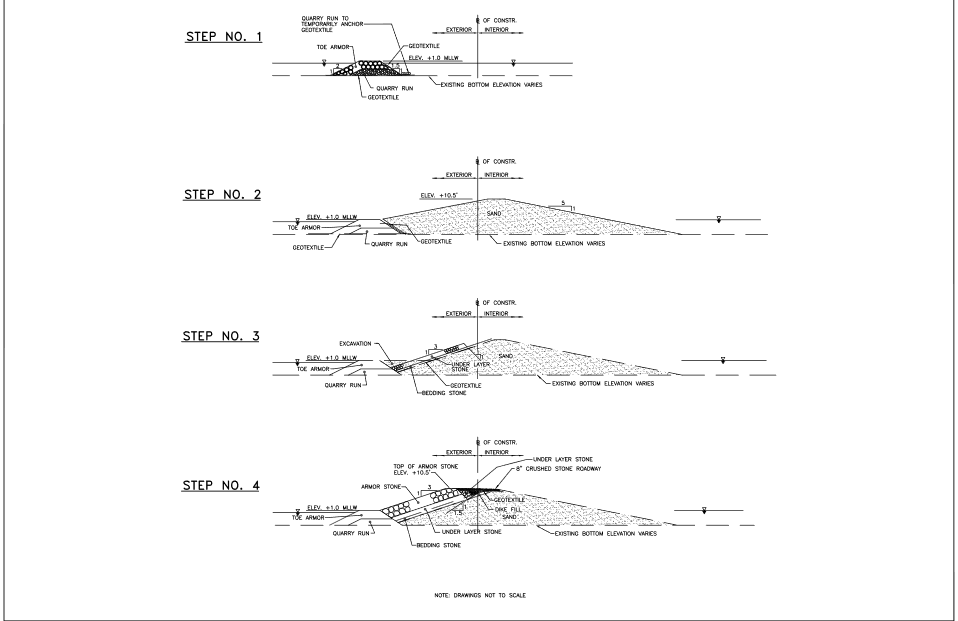
But how are these artificial islands created? Here is a very basic method statement:
1. First, the location is selected. Typically this is where an existing island has been eroded over time, as this offers a good foundation and relatively shallow waters.
2. Second, the new island perimeter is established by creating “toe embankments”. For this, large rocks (rip rap) are dropped from barges into the water until they form an embankment that protrudes from the water at high tide. This is the protective embankment that allows further engineering to take place.
3. Then the main embankments are created by pouring sand behind the toe embankments. The rip rap toes prevent the sand from washing away with the tide, thereby allowing sedimentation to take place (sand sinks to the bottom, water is pushed to the top). These sand embankments are built much higher and wider than the toes in order for construction vehicles to be able to operate on them as the project develops.
4. Sluice gates are then built into the embankment. This requires the construction of a cofferdam.
5. Next, dredged material is pumped into the enclosed perimeter and sedimentation is allowed to occur. Once this has happened, the sluice gates are opened to allow the water to run off into the Chesapeake Bay. This outflow is monitored for turbidity and other signs of contamination. If any of the safe levels are exceeded the gates are shut and more sedimentation is allowed to take place. This process of “pump in dredged material, leave to sediment, and open the sluice” is repeated until all the water is gone.
And that is basically it. USACE will soon be assisting with the design of another artificial island in the Chesapeake Bay and in an age where sustainability is being pushed and China is using such methods to extend their influence, I can’t see this kind of engineering losing any momentum.
