Archive
What is 3D geology modelling?
Aurecon regularly put on ‘Lunch & Learn’ sessions for their engineers. This is a great opportunity to here from other areas of engineering and hear about some cool engineering technologies being used across the company – yes, I used the words ‘cool’ and ‘engineering’.
Recently, an engineer from the geotechnical team delivered an interesting presentation on 3D geology modelling and it’s use on large infrastructure projects. As I am working in the bridge design team, I decided to go along and get some time away from superstructure ‘stuff’.
3D geological modelling is a key ground engineering technique, which is increasingly being utilized on large and medium sized projects, particularly for large linear infrastructure projects (think tunnelling and mining). Over the past two years, Aurecon has aligned to the use of the software ‘Leapfrog Works’, although a range of software applications exist. This was of interest to me, as I know it was used for the West Gate Tunnel Project (WGTP).
3D geology modelling is transforming the way ground engineering data is acquired, analysed, and communicated. Some of the key advantages are:
- Improved ability to compile large ground information datasets, which in turn improves the way you can capture and communicate geological complexity;
- Enhanced data visualisation, which aids with interpretation of ground risks and improves our ability to detect problems with input data or with the ground model;
- 3D geology modelling is visually engaging, which can enhance client or stakeholder presentations;
- Improved process efficiency and semi-automated section production;
- Dynamic integration with centralised ground investigation databases, allowing for rapid propagation of changes and revisions
- A centralised, online environment, that enables improved collaboration on modelling projects and allows for tracking of changes and improved model QA.
On the WGTP, 3D geology modelling (using Leapfrog) was used for the 6km of tunnels and supporting road upgrades to determine spoil volume, of which the Leapfrog model anticipated to be over 2 million cubic metres; this included earth and rock spoil material. This ability offers clear advantage for tendering purposes; how many spoil trucks will I need, etc.
In addition to this, it was also used to: highlight risks at the portals, model aquifer units used in hydrogeological impact studies, generate 2D sections for geotechnical ground movement modelling and was key for communicating risks/design to the client.
However, GROUND IS RISK!!!!!! (as a pen flies across the room towards Mr. Dale)
Like anything within the dark art of ground engineering, there is some considerable risk involved. 3D geology models do not just ‘magically’ understand everything about the ground and, like any software, require information input. Models are generally built from borehole data, ground investigations, etc. Therefore, most of the model will be based on interpolation and assumptions of ground conditions based off the data available.
Ultimately, clear communication of uncertainty remains a major risk, and the importance of good geological expertise is paramount when using 3D geological modelling. But the process and softwares available clearly offer a powerful tool for modelling and understanding the potential risks.
Prestress Losses and Excel
Apologies, but this blog is aimed at the Civils as a recap of Phase 1. My design team are now well into the detailed design stage of the three bridge widening packages I am working on.
One of the areas I have been focused on has been to check the prestressed Super-T Girders (pre-tensioned) that are being used on each bridge structure at the point of prestress transfer. So I thought I’d recap anyone interested in prestress losses for post tensioned members and thought I’d share the spreadsheet I’ve been working on for the last couple of weeks.
The Super-T’s are ‘off the shelf’ sections that have seen popular use across the state of Victoria for the last couple of decades. However, the lengths of these vary and as such, the choice of Super-T profile will be dependent on this, amongst other factors – generally the longer the span, the greater the moments etc.
My main role has been to check the concrete strengths (compressive and tensile) at the point of transfer. The precast Super-T’s are to be ‘steam’ cured to allow the prestress transfer to the concrete to occur at 24 hours.
Considering there are 3 bridge structures with a total of 12 spans ranging from 24m to 39m and proposed Super-T depths of 1200mm and 1500mm, I decided to create a spreadsheet to speed up the process – I initially started by hand, which was taking a long time and was very environmentally unfriendly!
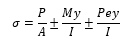
I started by going back to lecture notes/slides from Phase 1 and familiarised myself with Bungey, Mosley and Hulse (Reinforced Concrete Design to EC2); noting I am working to Australian Standards (AS5100.2 and AS5100.5 – so this could be of use to Mark) however it was useful for the analysis, such stress calculations:
For a pre-tensioned member such as this, prestress losses include: Elastic shortening of the concrete, creep and shrinkage of the concrete and relaxation of the steel.
The losses I was concerned with initially was the immediate losses at transfer. For pre-tensioned concrete, when the tendons are cut, and the prestress force is transferred to the member, the concrete undergoes immediate shortening due to prestress. The tendon also shortens by the same amount, which leads to loss in prestress.
Elastic shortening is dependent on the modular ratio and average stress in the concrete at the level of the tendons. Given there are 40+ strands at various distances above and below the centroid of the member (see section), I have taken a simplified approach, which is to use the centroid of the strands; this changes along the beam where some strands are de-bonded towards the end of the beam.


In short, the elastic shortening is quantified by the drop in prestress in a tendon due to the strain in the tendon. By calculating the strain in the tendon, it is possible to know the strain in the concrete as they are assumed the same; i.e. the concrete strain is the same as the steel strain. By knowing the strain in the concrete and the elastic modulus (which is taken at 24 hours), we can calculate the stress in the concrete – this is also true for the top and bottom of the beam.
Once the stress in the concrete at the top and bottom of the beam is known, we can check that compressive and tensile stresses are not exceeded at a concrete age of 24 hours. And by knowing the stress in the concrete at the centroid of the tendons, we can calculate the prestress loss. However, this is an iterative process, as the prestress originally used in the calculation (i.e. 100% of the jacking force) was incorrect as there was a loss – this is where excel makes it much quicker!!! (I have used the goal seeking function to do this).
In addition to this, I have included longer term effects by calculating creep and shrinkage losses, thermal effects (which includes a very funky polynomial graph to the 5th power – this took a day in itself to set up), and residual creep losses.
Anyway, I thought I’d share the spreadsheet (that is set up for the 1200mm deep Super-T’s in these pictures) for anyone interested or in case anyone finds themselves needing it – noting this is set up to Australian Standards and not EC.


The spreadsheet explains the critical points of the beam to check – as a note, I have set the critical points for one half of the beam only as beams are symmetrical. If anyone has any questions, feel free to ask!
I had trouble uploading the spreadsheet so there are some pictures below of the input data and summary pages or you can access via the following dropbox link: https://www.dropbox.com/s/uh68yephxky4rk3/Super%20T%20Prestress%20Losses%2C%20Thermal%20Effects%2C%20Creep%20and%20Shrinkage.xlsm?dl=0
On another note, my excel skills have improved drastically – turns out it is far more powerful than just creating nominal roles …


Removing the Toe
Just thought I’d post a quick blog about some geo stability issues we have been conducting recently (should get some flashbacks of Phase 1!).
We have just completed submissions of three Preliminary Design (PD) packages for three bridge widening design packages as part of the Monash Freeway Upgrade in Melbourne (see my last blog for details for those interested).
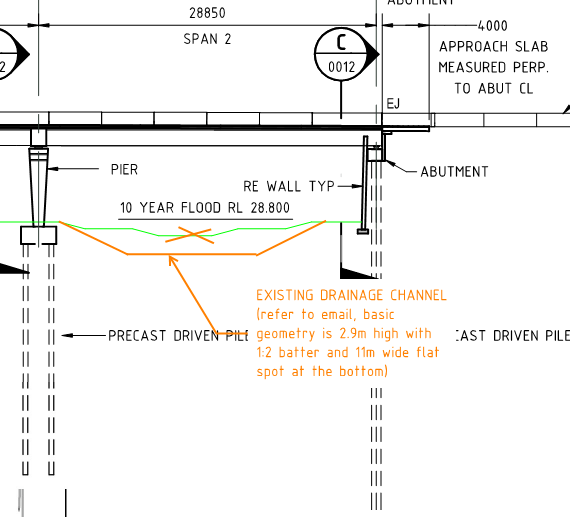
Some new information recently came to light regarding a recent channel construction by Melbourne Water between a pier and abutment of one of these bridge’s substructures (Officer South Road Bridge – East Abutment)
The earthworks undertaken as part of the original construction for this bridge included the excavation of a 1.2-1.8 m deep open channel drain between the central pier and eastern abutment. It has now come to light from the Principle Contractor (our client) that this channel has recently been augmented to cope with increased flows.
The recent works have increased the channel depth to 2.9 m and the channel now occupies most of the space between the pier and abutment (11m bottom width and 22m surface width). The newly supplied drawings show a 3 m gap between the abutment wall and the crest of the channel and indicate a battered slope of 1V:2H.
Previous assessments of the abutment/reinforced wall were not available at the time of the PD report preparation and so the impact of the 3 m deep channel excavation was not assessed. There is also no understanding as to whether the global stability of the abutment was considered by the party who extended the channel.
An assessment of this, and the effect on the design we tendered for were not part of the scope, meaning we are now awaiting decision from our client on how to proceed (variation to our scope/contract, use another (specialised) consultant to conduct an assessment, etc.).
To gain an understanding of the global stability effects and impact of the earthworks, we decided to conduct a quick preliminary assessment of the GEO stability of the abutment prior to, and following, the 3 m excavation. The assessment for now only considers the long-term stability the stability during construction will need to be assessed too – but time is money… so we aren’t exactly quick to conduct an assessment).
To do the analysis, we used ‘GeoSlope 2019’ software, which is rather like the software we used with John Moran in Phase 1 (the name of the software escapes me…). The screen shot below demonstrates the ground model and parameters used, which has been taken from borehole data and a geotechnical investigation report.
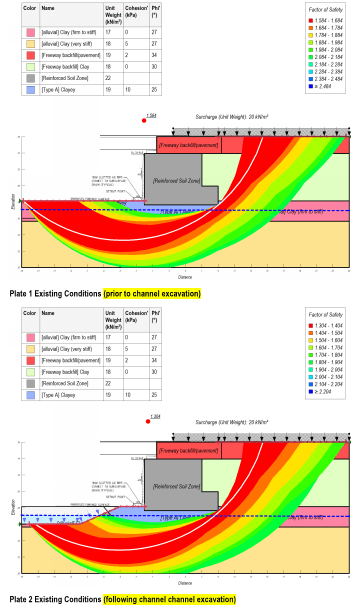
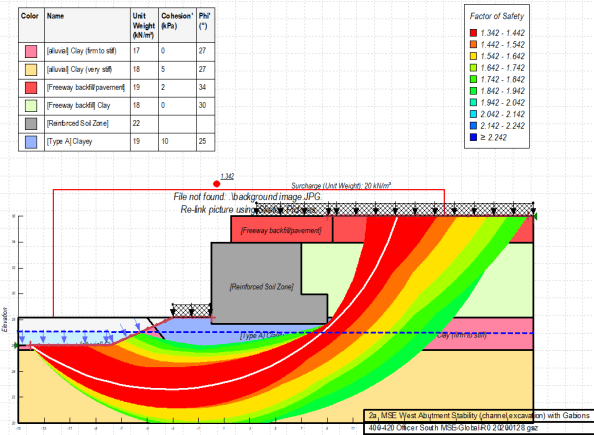
The results of the analysis show that removing the soil at the support will likely reduce the FOS to 1.3, is below the 1.5 figure preferred here. However, saying that, the model has some assumptions, which could be refined by a more detailed geotechnical analysis and could consider the effects of the piles resisting the forces within the slip plane – though I believe we will now need to consider the shear/bending effects this will have on the piles which could up the reo and increase cost to the client.
We also modelled the use of gabion walls in front of the abutment (shown as a surcharge in front of the abutment), but the analysis showed a raise of only ~0.4 FOS.
I suppose what has been alarming to me is that, by all accounts, no check was conducted by the contractor responsible for excavating this channel – it appears they have blindly excavated without consideration to how the soil in front of the abutment is providing passive resistance to the abutment toe.
As this information was not provided during tender, the risk is with the client. i.e. do they want to conduct a more detailed geotechnical investigation to refine the model? Do they want design work conducted to improve the geo stability of the abutment? We shall see.
Anyway, just a little snap shot of some geo stuff we were exposed to on Phase 1 that I’ve had the chance to utilise during Phase 3 (which as a bit of a surprise working in the superstructures side of things).
Phase 3 at Aurecon
Following on from Mark’s last blog, I thought I’d give a quick update on where I am and what I’ve experienced so far on Phase 3 in Melbourne. Firstly, Mark has now joined me out in here, working just 5 minutes away from my project office, so It’s good to have some more Sappers around after Auggy and Glynn finished up in June.
I am working for Aurecon, a global consultant operating in 26 countries, primarily across Australasia, Africa, South East Asia and the Middle East. It’s been an interesting move, as Aurecon were the designers (in a Joint Venture (JV) with Jacobs) for the West Gate Tunnel Project (WGTP) – where I was placed for Phase 2 – and have found myself working with some of the team employed on the WGTP, so it’s been interesting to hear their thoughts on the project delivery aspects.
I’ve managed to distance myself from the WGTP (I wanted to get away from it and expose myself to something different) and am working on stage 2 of the Monash Free Way Upgrade (MFU), where I am working in Aurecon’s South Australian and Victoria (SAVI) Bridge Team; the project is another JV so several of the team are from GHD. The MFU project, in very short terms, is a major freeway upgrade to south east Melbourne’s main traffic corridor (think the M2 to London). The route will see several traffic lanes increased to the existing freeway in both directions (some 36kms as part of stage 2 – stage 1 (now completed) saw 30kms widened). This 36kms includes several existing bridge structures that will be widened to accommodate the increased traffic lanes/loads.
My role is officially two parts: ‘Bridge Engineer’ and ‘lead package engineer’, effectively coordinating the design of three of these bridge structures. Each structure is formed of prestressed (post tensioned) precast Super-T girders composite with a RC deck slab. Each structure varies in length, with the shortest being simply supported across two spans of 25.7m and the longest being simply supported across 8 spans varying up to 39m each. All utilise RC piers and abutments except for one prestressed pier. Fortunately, all the bridges (except for the one bridge which will utilise existing substructures previously designed for future bridge widening works) will utilise 400mm square precast concrete driven piles – the exact same ones I got so much joy out of on the WGTP …
So far, I’ve been responsible for producing two preliminary design reports (with the third coming next week) along with ensuring drawing packages are ready for release to the client for comment/approval. This has been challenging as most of my design team are based out of South Africa … communication seems to be the real challenge.
I’ve found myself going back over Richard’s and Shardi’s lectures recently, trying to piece back together lessons on prestress, post tension losses and grillage analysis (looks like I’m that ‘traditionally 1 in 3 students will…’ student) whilst learning the software ‘Midas Civil’ to model my bridge decks and structures (the software of choice in my team).
Like Ash’s earlier post, it seems all the younger engineers rely on the software first to model their structures without doing ‘hand calcs’ – while the more experienced engineers are using the software after running numbers on paper first.
I’m now modelling some of my Super-T girders in Midas, as well as performing some grillage analysis (slowly I must add). Midas is interesting as you can model the entire structure, including the substructure and piles, and run static/moving load analyses on the entire structure – to me, this seems like there’s a lot that could go wrong while being very confident/relying on the input parameters/data to be correct John’s ‘Rubbish in = rubbish out’ keeps coming to mind).
Anyway, here’s some pretty pictures of what I’m modelling at the moment – hopefully it works …


Using Dynamic Pile Driving Formulas on Site
I thought I’d post this blog as it is directly relatable to my thesis topic and highlights the risk of ‘boundaries’ regarding geotechnical engineers and pile design.
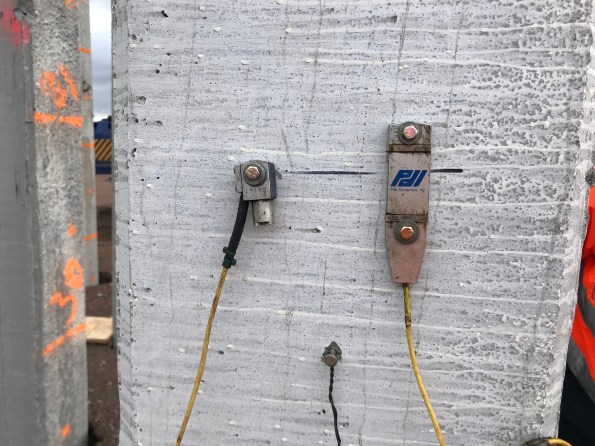
The marine piling package is well underway on my project, with 5 piles installed to date. I am not overseeing this package (I am focussed on substructure works on the eastern bank of the site) but have been keeping myself up to date with the marine piling QA as my thesis is aimed around pile driving formulas and will use primary data from our pile driving records/CAPWAP analyses.
A few weeks back, one of our piles (P1-P09-PSP-01) was driven to design depth but failed to reach End of Dive (EOD) capacity, recording a set of just 5.1mm per blow at ~280kj of energy. This pile is an open-ended steel tube with a diameter of 1600mm, pile wall thickness of 25mm and pile shoe of 1m long by 50mm wall thickness. It is designed to carry a geotechnical design load of 21MN.
Piles have been driven using an IHC S280 hammer, and was initially driven with Pile Driving Analyser (PDA) equipment to a penetration of 21.77m (-32.36m RL). The PDA EOD indicated that the pile had an inadequate resistance at this depth. The PDA equipment had to be removed due to the risk of water damage (i.e. the gauges were at risk of being submerged in the River). A CAPWAP analysis was carried out on one of the final blows at this stage of re-driving, also proving inadequate capacity.
Though both a borehole was taken at each pier location and the pile itself was fabricated with an extra 2m length to mitigate risk of failing to reach capacity at design RL, this situation highlights the risk of certainty in geotechnical boundaries.
The pile was driven further without PDA monitoring and the set was monitored using survey. The pile was driven to a final toe level of -32.8m RL. The final set achieved was 1.6mm (per blow) at maximum hammer energy (~280 kJ). This was positive, suggesting the basalt rock layer had been established.
For the project to date, PDA testing and CAPWAP analysis have been undertaken on all previous marine piles to confirm capacity. This has enabled correlations to be developed to PDA/CAPWAP to pile installation parameters (i.e. you can use sets achieved on previous piles to estimate pile capacity). As no PDA equipment was attached for the final driving of the pile (and thus no possibility of CAPWAP analysis), an alternate approach to pile capacity verification was required.
Without going into too much detail, hundreds of dynamic pile driving formulas have been derived since the mid to late 1800s. In Victoria, the Hiley Formula is referenced for use in VicRoads publications, which is dated and requires input of several parameters. One such input is the Temporary Compression (TC) measurement of the pile (effectively the energy lost during hammer impact due to elastic compression in the pile, soil and cap). TC energy losses are on of two types on losses experienced, the other be Newtonian Impact Theory (effectively a coefficient of restitution that is used to indicate how much of the original kinetic energy remains after the impact of two objects)
TC could not able to be recorded onsite due to the difficulty obtaining this measurement due to the pile becoming submerged and the hammer sleeve ‘covering’ the top of pile. This prevented the Pile Driving Monitor (PDM) from being used to record TC.
Therefore, the geotechnical engineers required use of a pile driving formula that does not incorporate TC. Stringent rules allow for this and is only considered appropriate in cases where:
-
- There is a high proportion of piles subjected to PDA/CAPWAP;
- Hammer energy measurement is undertaken to confirm hammer performance;
- There is a high level of engineering supervision and the standard of piling QA is high.
These requirements were considered met so the geotechnical engineers decided that the ‘Gates Pile Driving’ Formula (developed in 1957) would be used to allow estimation of pile resistance. The Gates Formula is as follows:
𝐺𝑎𝑡𝑒𝑠 𝑅𝑒𝑠𝑖𝑠𝑡𝑎𝑛𝑐𝑒 𝐹𝑎𝑐𝑡𝑜𝑟 = 27 ∗ √𝑒ℎ ∗ 𝐸 ∗ (1 − 𝑙𝑜𝑔10 (s/25.4))
where: s is set in mm
eh is hammer efficiency (assessed as efficiency of energy transfer to the pile from PDA measurements on other representative piles)
E is the hammer energy delivered to the pile.
As the Gates Formula was developed in US units (i.e. kips, ft) the formula does not result in a resistance in metric units (i.e. kN). To avoid the need to convert all units to US and redefine the constants in the equation, the Gates Formula was used to evaluate a ‘Gates Resistance Factor’ which is proportional to the estimated resistance. Importantly, this is subsequently correlated to CAPWAP resistance.
A correlation factor is necessary between the GRF and the PDA/CAPWAP capacities determined from analysis on representative tested piles (i.e. piles already installed). This correction factor is termed Gates Correction Factor (GCF) and is calculated as:
𝐺𝐶𝐹 = CAPWAP Resistance / 𝐺𝑅𝐹
|
Test No. |
Toe Level (Test) | Pile Penetration (Test) |
Driving Stroke |
EOD
Driving Set |
Driving TC |
Test Type |
Test Set |
EMX |
RMX |
Potential Energy |
Hammer Efficiency |
| – | m RL | m | mm | mm | mm | – | mm | kN- m | kN | kN-m | – |
| C1-P03- PSP-03 EOD |
-31.53 |
19.33 |
2040 |
0.50 |
13.90 |
EOD |
0.5 |
248 |
33529 |
280.2 |
88% |
| C1-P03- PSP-04 EOD |
-32.45 |
15.65 |
1600 |
1.40 |
12.60 |
EOD |
1.4 |
218 |
28303 |
219.7 |
99% |
| C1-P03- PSP-04 RST | -32.45 | 15.65 | 1700 | 1.40 | 12.60 | RST | 0.7 | 228 | 29517 | 233.5 | 98% |
| C1-P03- PSP-04 RDV |
-32.45 |
15.65 |
2040 |
1.40 |
12.60 |
RDV |
1 |
269 |
32231 |
280.2 |
96% |
| C1-P03- PSP-02 EOD |
-35.10 |
13.00 |
1600 |
2.30 |
11.70 |
EOD |
2.3 |
207 |
19863 |
219.7 |
94% |
| C1-P03- PSP-02 RST | -35.10 | 14.50 | 2040 | 2.30 | 11.70 | RST | 1.3 | 269 | 25067 | 280.2 | 96% |
| C1-P03- PSP-01 EOD |
-35.07 |
13.20 |
1455 |
2.80 |
10.20 |
EOD |
2.8 |
191 |
18827 |
199.8 |
96% |
| C1-P03- PSP-01 RST | -35.07 | 14.30 | 2040 | 2.80 | 10.20 | RST | 1.7 | 270 | 24708 | 280.2 | 97% |
| P1-P09- PSP-01 RDV |
-32.36 |
21.77 |
2040 |
5.10 |
– |
RDV |
5.1 |
276 |
22475 |
280.2 |
98% |
The table above demonstrates the results of the testing conducted (EOD and CAPWAP) on the 4 previously installed piles for correlation for Gates. The table below shows the pile resistance factor values calculated from the Gates Formula, as well as capacity evaluated from CAPWAP and the GCF.
For all tests (excluding Pile C1-P03-PSP-03 EOD which is considered unrepresentative) the energy efficiency ranged from 94 to 99% (an important parameter for formula input), with an average of 96.8. A Lower Bound efficiency of 94% was adopted in estimating resistance for pile P1-P09-PSP-01.
|
Test No. |
Gates Resistance Factor |
CAPWAP Compressive Capacity |
GCF |
| – | – | (kN) | |
| C1-P03-PSP-03 EOD | 1149 | 33500 | 29.1 |
| C1-P03-PSP-04 EOD | 900 | 25555 | 28.4 |
| C1-P03-PSP-04 RST | 1044 | 29570 | 28.3 |
| C1-P03-PSP-04 RDV | 1065 | 32280 | 30.3 |
| C1-P03-PSP-02 EOD | 792 | 19700 | 24.8 |
| C1-P03-PSP-02 RST | 1014 | 25080 | 24.7 |
| C1-P03-PSP-01 EOD | 730 | 18790 | 25.7 |
| C1-P03-PSP-01 RST | 966 | 24670 | 25.6 |
| P1-P09-PSP-01 RDV | 761 | 22315 | 29.3 |
The Gates resistance values are generally seen as lower than the CAPWAP resistances with GCF values from 24.8 to 30.3. These are plotted against pile set below to provide a line of best fit of pile set against the Gate Factor. Using this and the set obtained at EOD (1.6mm) for pile P1-P09-PSP-01, the GCF equates to ~27.
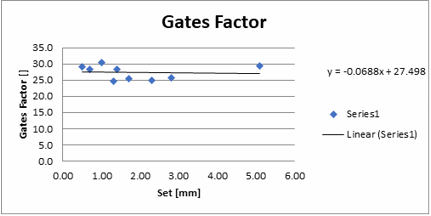
Using the below parameters, The Gates Pile Driving Formula estimates a resistance of 26,173kN at end of redrive.
Set = 1.6mm
Hammer Energy = 280kJ (IHC S280) Hammer Efficiency = 94% (LB)
Gates Correlation Factor = 27
This is well above the required capacity of the pile (~21MN) and is therefore considered competent. In addition to this, the previous piles have demonstrated a ‘set up’ (refer to my previous post) of 15%-31% increase over 24 hours (minimum required time between EOD and Restrike Test (RST)) – See table below. This suggests further assurance to capacity and thus QA of the pile.
|
Test No. |
Compression Shaft Resistance |
Toe Resistance |
Compression Capacity |
Toe Level (Test) |
Shaft capacity improvement (%) |
Overall Capacity Improvement (%) |
| kN | kN | kN | mRL | |||
| C1-P03-PSP-04 EOD | 8055 | 17500 | 25555 | -32.450 |
146% |
115% |
| C1-P03-PSP-04 RST | 11770 | 17800 | 29570 | -32.450 | ||
| C1-P03-PSP-01 EOD | 7390 | 11400 | 18790 | -35.070 |
161% |
131% |
| C1-P03-PSP-01 RST | 11970 | 12700 | 24670 | -35.070 | ||
| C1-P03-PSP-02 EOD | 7700 | 12000 | 19700 | -35.100 |
150% |
127% |
| C1-P03-PSP-02 RST | 11580 | 13500 | 25080 | -35.100 | ||
| P1-P09-PSP-01 RDV | 9765 | 12550 | 22315 | -32.363 |
152% |
124% |
| Average | ||||||
The use of the Gates Formula on site to assure capacity of this pile has been, coincidently, very useful for my Thesis and demonstrates alternate methods of assuring quality. The importance appears to be in the ability to both/either accurately measure parameters/input data on site and correlate results with a data set. Without having yet asked, I wonder what the solution might have been had this been the first pile? Maybe install further piles and hope to achieve resistance and use the parameters obtained to correlate as was in this case? Or would they have bit the bullet and spliced the pile on site – rather tricky being in a marine environment from a barge, especially given the high QA regime and Workplace Health & Safety controls?
Unexpected Depth
I’m currently the Project Engineer overseeing the construction of 2 large pile caps (2 of many pile caps across my scope) for the main bridge crossing the Maribyrnong River in Melbourne, part of the West Gate Tunnel Project. We are aiming to start pile cap construction on completion of piling.
We had an interesting pile refusal I thought I’d share and get some feedback on?
Given the size of these particular pile caps, it should provide a unique experience into the construction process and QA. To give an idea of the pile cap sizes and loads being transferred from superstructure into the ground, each pile cap consists 46 precast piles, each 34m length. Due to the length of these piles, each pile is made of 3 segments, spliced in two places. The bottom segment is 10m long with the middle and upper sections 12m long. Each pile cap will consist 370m3 of concrete (16.6m x 7.2m x 3m deep), 108T of reo and will have post tension bars protruding out the pile cap and up into the precast column – a feat in itself to ensure correct lengths were procured with threads considering elongation lengths (3-6 month lead time required due to fabrication in South Africa) and potential clashing with pile cap reo; we are currently conducting 3D modelling to detect any clashes.
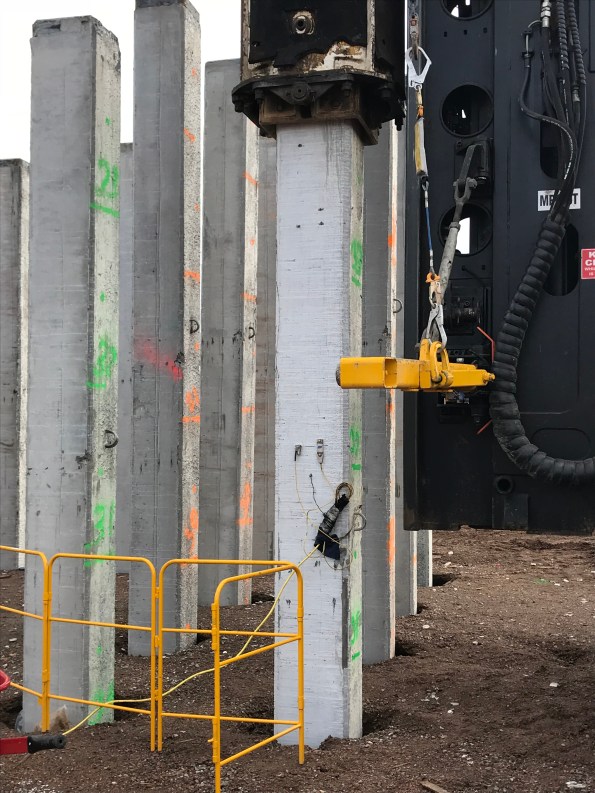
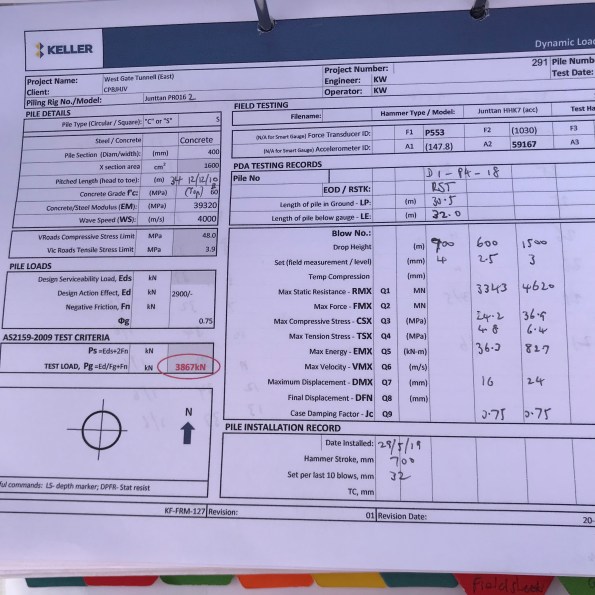
During piling this week, everything was going well until a single pile refused well above the expected depth – piles are driven to a layer of basalt rock approx. 32m deep and are considered end bearing. Each pile is designed to take a geotechnical design load of 2900kN, which is very high for a precast pile. The pile in question can be seen below. The variability of the basalt rock layer can be clearly seen.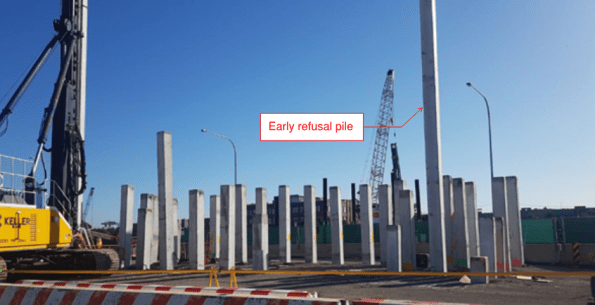
e believe the pile has refused on ‘floating basalt’ (i.e. a large basalt boulder in the upper silt layers). Because it has refused on the basalt, it has the required ultimate geotechnical capacity of 3867kN (note this is the 2900kN with a reduction factor applied – a different approached used under Australian Standards from that used in EC7).
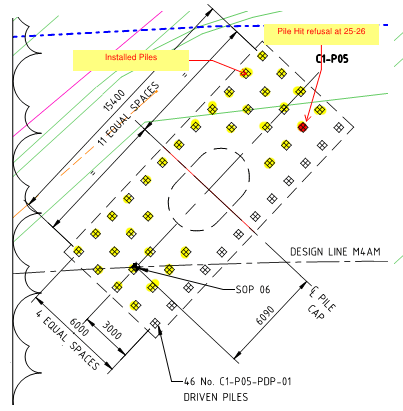
Pile cap Plan
We can’t just crop the pile at the current depth for a couple of reasons. Firstly, the top splice joint is 0.5m below pile cut off. Under VicRoads 605 (Driven Piles) publications, a minimum depth of 5m is required for splices, due to durability (a blanket requirement that doesn’t seem to consider soil properties at individual sites?). Also, I believe this depth ensures bending moments, which are increased near the top of the pile, are not too excessive at spliced joints.
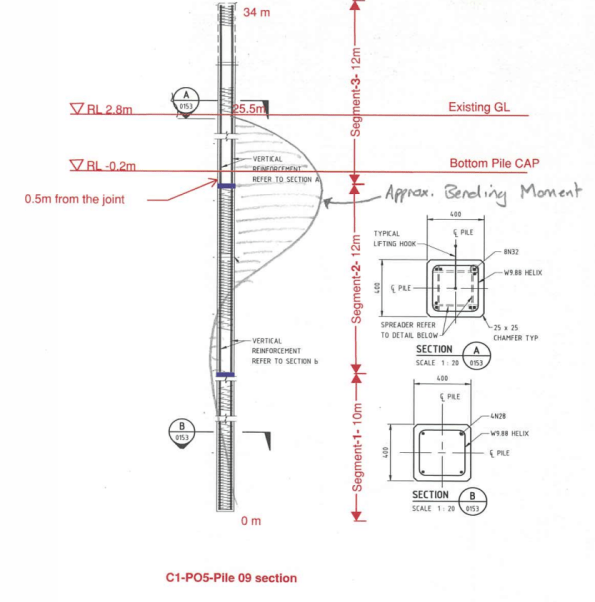
Refusal Depth and Estimated Bending Moment
The other issue is that the steel reo in the middle section pile is not sufficient structurally to transfer load from the pile cap to the pile (top segments have almost twice the reo).
As the pile has reached geotechnical capacity, I believe a replacement pile need only be required to add additional structural support (i.e. shear and bending capacity) – i.e. install a top segment pile as a floating pile next to the refused pile, providing the structural capacity required without carrying any geotechnical load.
However, the decision was taken to install a longer pile (matching the refusal depth) using segments with adequate reo. This, to me, seems slightly more conservative given geotechnical capacity was proved? Either way, the importance of getting a decision signed off quickly was paramount to allow piling to continue and keep on schedule – a decision was made within 24 hours.
I’ll upload a blog once these pile cap begins construction!
Precast pile de-heading
Hi all! I just thought I’d put up a quick post about a new technology/process I have been involved with this week.
Having almost completed the first stage of precast pile installation on my site, we are ready to start de-heading piles in preparation for pile cap construction.
Pile de-heading is recognised as a risky activity within the construction industry. Eventually, approximately 4500 precast concrete piles (13,500 individual pile segments when considering spliced piles) will be installed across the east zone of the West Gate Tunnel Project. Given the inherent risk of the deheading activity, a concerted effort has been undertaken to investigate the safest ways to undertake each stage of the process.
A lot of thought and consideration has gone into the different methods available to remove or reduce the people and plant interface, a High Risk Construction Work Activity under Victoria Worksafe (Vic State version of HSE), which are activities involving people working in close vicinity to items of plant.
De-heading or pile-trimming refers to the practice of cutting piles to a pre-determined level after they’ve been driven into the ground to the required depth or capacity, which is around 30 metres generally across the East Zone and 12m-14m across the scope of works conducted thus far on my area of responsibility.
Traditionally a number of methods have been used to perform the de-heading, including workers using hand-held ‘demo’ saws in combination with plant to support and remove cut sections. Typically, this activity involves a crane holding the pile, while workers saw cut the concrete and corner longitudinal reinforcement This involves a lot of people/plant interface and other safety risks such as: falling concrete segments, potential silica dust inhalation, injuries associated with repetitive tasks (such as ‘White Finger’ vibration injuries) and exposure to loud noises.
After investigations into safer options with the piling subcontractor ‘Keller’, it was decided a much safer method for these works was to use an excavator with a de-heading attachment.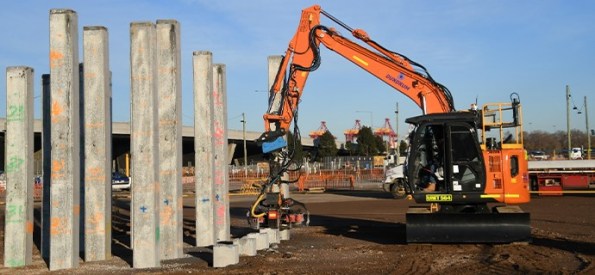 How does it work?
In simple terms, after the de-heading attachment is connected to an excavator arm, it connects to a pile and its blades cut through the reinforcing steel at each corner. Another excavator then moves in, grabs the pile and snaps it at the cut-off point and then carries the excess length of pile directly to the waste skip for removal. This technology is not entirely new and has been used before in Australia, but rarely, as it suits projects with a large-scale piling requirement, such as ours due to the increased costs.


The main benefits of using this pile-trimmer method include:
1. Safety: as this process is undertaken via an excavator, it completely removes the people/plant interface.
2. Environmental improvements: it’s quieter than other options, such as jackhammers, while dust dispersion is mitigated as the device ‘self-doses’ water during cutting.
3. Increased productivity: this method is quicker than other de-heading methods, meaning increased cost of plant/technology can be saved against traditional methods through saving in time and project schedule.
4. A better result: the end of the cut-off pile is ‘cleaner’ than it would be using other methods.
What’s next after the pile de-heading?
unfortunately, the plant trimming method cannot be used down to the final cut-off level of the pile. After the piles have been trimmed to the correct height (300mm above the surface), the next step is known as breaking-back the pile. It involves digging around the piles to the cut-off level, then chipping away the concrete to exposing the reo bars.
This is another process that will be performed mostly by excavator, with only minimal use of a jackhammer at the final stage, to expose the reinforcing steel. Again, reducing the risks to workers on site.
This method of pile de-heading is a big step forward for safety across the industry and will likely see increased use in the future, especially with Tier 1 Contractors.
Melbourne is Settling!
I just thought I’d share a quick blog on some interesting settlement issues I noticed walking through the ground level storey of a multistorey carpark last week. Whilst passing through, I noticed some serious concaving of the pavement between column rows, creating a wave like effect across the whole car park. On closer inspection of the columns, I noticed that the top of concrete foundations were protruding out of the asphalt surface. The reason for these ‘dips’ in the carpark are due to some very noticeable settlement of the underlying ground.


Across the wider area is a varying depth of Coode Island Silt (aptly named after the area known as Coode Island in Melbourne where I am working). Having done some research into the geology for TMR 1, the existence of this silt layer is not surprising, considering Melbourne was found on a huge swamp along a large river basin.
The Coode Island Silt is a large alluvial deposit along what is known as the Yarra River (main waterway passing through Melbourne) Delta. It is a highly compressible soil which is only lightly consolidated and has a high voids ratio, making it very prone to settlement and creep when stressed – think back to the graph plotting voids ratio against effective stress; no stress history on a soil with a high voids ratio will lead to high strain. This limits the use of shallow foundations across Melbourne, making piled foundations a favoured solution.
The inherent risk of both primary and secondary settlement is high for foundations formed in this soil and downward drag (i.e. negative skin friction) presents significant risk for deep foundations. From researching the GDRs produced for my project, downward drag from the Coode Island Silt consolidating is expected in less than 3 years. The forces induced will be a function of the rate and size of settlement at each pile location, the skin friction induced along the pile shaft (depth of the silt varies significantly across my site) and vertical movements under live loading; Negative skin friction is not considered for ULS design due to piles settling relative to the surrounding soil – as previously taught in Phase 1. This means it must be considered in SLS design to ensure long term settlement does not have negative affect – or cause issues like those seen in the carpark!

I hope this is of some interest to those who might not be working ‘in the ground’ and highlights the importance of the estimating stress history of soils.
Engineering Judgement vs Specifications
Over the last 2 weeks we have started installing precast concrete piles on my site using, from what I can tell from research and talking with previous PET(C) students working in Melbourne, a very experienced piling contractor (Keller). The first 7 days of piling have seen several pile caps complete, with over 50 piles installed; a total of 548 are being installed over the next 12 months, excluding CFA and Steel Driven piles.
Those who read my last blog will have seen the QA and testing process implemented on site to ensure compliance of piles against the design specification. As the Project Engineer tasked with overseeing these works, I have been involved daily with inspections of precast concrete pile deliveries and PDA testing, whilst managing the site engineers.
Since my last blog, a concrete patch repair procedure has been accepted by the IREA (third party auditor) and the Nominated Authority (in house auditor), meaning blow holes can now be repaired on site. It should be noted, however, that cracks cannot be repaired using this at this stage.
As part of the Inspection Testing Plan, the Nominated Authority own the Hold Point of testing of the piles to ensure geotechnical design capacity is reached. This week, we have had a few issues arise. One is that some piles tested are not achieving pile capacity on either end of drive or on restrike (see my previous post for more info). This issue is being resolved with the subcontractor and the designers to see how this can be dealt with. My SPE seems to think that we can still get away with the results we have by proving the end bearing resistance with quick calcs … I’m not so sure how this proves geotechnical design capacity? To me, the summation of shaft and end bearing resistance has failed to mobilise enough capacity, even after 3 days of ‘setting up’ prior to restriking. I would assume additional piles will be required, unless there was enough design contingency planned?
It appears that no piles are reaching geotechnical design capacity at end of drive. As per my previous post, the first pile in a group is driven under PDA monitoring to monitor driving stresses and set the driving criteria for the remainder of the group. I spoke with the testing engineer about this, who has over 20 years’ experience of PDA testing and just so happened to work for PDA in America previously (so I’m taking his advice as rather expert). He does not expect any pile to achieve end of drive resistance due to the high design capacity required (2900kN is the ultimate design load for most piles. This is given a reduction factor of 0.75, meaning 3867kN is required) given the short 12m/14m length of piles but is confident that, where a set of 35mm (average movement of the pile per 10 blows) is achieved, the capacity will be achieved given time to set up; i.e. capacity will be achieved on restrike (clearly not the case for some piles above).
What has surprised me is the huge variability in the basalt rock layer the piles are being driven to. It would appear that all our lessons on ground being a risk couldn’t be truer. The rock levels from the ground model (created from interpolation of boreholes) shows a nice straight line to design the pile toes to. As can be seen from the photo below, this is not the case. In some pile caps, variability increases by over 4m and more. This creates a cost issue, as, under VicRoads Specification 605, restrike tests are required to be carried out where toe levels of piles in a group vary more the + or – 2m. Each restrike test is a cost to us.
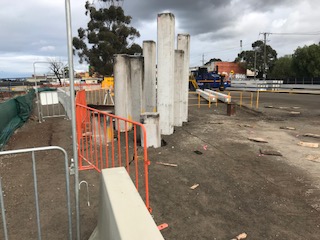
Front two piles can be seen to refuse much deeper than remaining piles due to variability in the basalt rock layer
The main issue we’ve had has been the releasing of a Hold Point under the Nominated Authority. If we are to go by the letter of the law, the VicRoads 605 specification and pile installation ITP (which takes the hold point straight from the spec) state that the first pile driven, which is under PDA monitoring, must have a restrike test if geotechnical design capacity is not reached on end of drive. For the pile and pile group in question, the first pile did not achieve the capacity at end of drive and is one of 10 piles in the group. It just so happened that this pile achieved the lowest set (21mm) of the group, with the highest set being 32mm. Under the VicRoads spec, only 10% of piles require a restrike, meaning only one pile required testing. Keller’s testing engineer, rightly in my mind, chose to test the pile with the 32mm set. For those unaware, the pile with the highest set is theoretically the pile in the group with the lowest geotechnical capacity. This is simply because the pile has moved more than any other pile under the same hammer weight and energy, therefore experiencing less resistance from the soils.
However, although ultimate geotechnical capacity was achieved on the restrike of this pile, the Nominated Authority refused to release the hold point because the pile test was not the first pile driven and monitored in the group. This seems silly to me. I would have thought that by proving the pile with highest set in the group, pile capacity of all piles has been proved? The logic of the testing engineer seems sound to me and I would argue that the intent of the spec is to prove capacity of the group, which I believe has been done?
The Nominated Authority, as has been the case with other issues, seem to blindly follow what is written in the spec and not apply any engineering judgement or consider the intent. In which case, what would be the requirement for engineers on site?
Either way, I have now had to raise a NCR to the Client to argue the case that capacity has been proven and that this method should be adopted moving forward.
Displacement Piling Precast Piles
G’Day from Melbourne!
As there have been significant delays to construction starting on my site (401), I have spent the last couple of days on a site elsewhere on the West Gate Tunnel Project (403) where they have been installing precast driven piles. I’ve used this time to understand driving process and QA regime in preparation for similar works starting at 401.
Of interest has been the rejection of several precast piles by the Principle Contractor (CPBJH JV). Piles, as per a previous post of mine, have been cast by the piling subcontractor as part of a Design & Build Contract. I have also taken keen interest in the testing of piles and the process of restriking.
With this post, I hope to provide those on attachment with no involvement of precast concrete structures or driven piling operations with an insight to what I have learnt, and maybe get some thoughts?
Rejected Piles
Precast piles, under VicRoads (VR) 610 specs, must have a Class 1 finish. This is a durability requirement given that piles are subject to aggressive subsurface conditions. On 403, and undoubtedly an issue we will forego at 401, several piles have been rejected due to surfaces having excessive ‘blow holes’; a result from the entrapment of air during casting. The standards we work to state that blow holes over 15mm in diameter and /or 5mm in depth must be repaired prior to installation.
The issue we have is that there are no approved repatching procedures for the project. This means, under the PSR, that piles cannot be repatched and must be rejected; a cost risk held by the subcontractor but one that will delay CPBJH JV further. I’m amazed that no procedure exists and, as you can imagine, there are a lot of people scrambling around to get one in place. Simple? It would appear not. Several procedures have been submitted for approval but, after review, have all been rejected by the IREA (the Client’s third-party auditor) for being non-compliant with the PSR.
What surprises is me is that the subcontractor hasn’t just had a go at patching at their yard off the cuff given that this is their trade? Clearly this would result in a NCR (Non Compliance Report) but possibly worth the risk for them? Considering they have delivered the piles to site and are cracking on (ignore the pun) seems to me that they planned to install them anyway, and hope no one would notice? As can be seen in the picture below, the extent of some blow holes seems very minor (see pictures below). I’d be interested to know if anyone else has seen this, has experience in the matter or would have a solution that doesn’t involve weeks of submitting approvals and replying to comments prior to acceptance?


Testing and Restriking
As per VicRoads Spec 605 (Driven piles), the first pile driven in each pile group is tested and the ultimate capacity is determined in accordance with the formula used in design (Hiley Formula). The test then determines the driving set for each pile group by correlating the set with the driving system and the designer’s requirements for the pile test loads (these must be demonstrated on the design drawings). All piles within the group are then driven to a set that does not exceed the driving set determined by the first pile.
The method of testing for this project is Dynamic Load Testing (aka dynamic loading). Dynamic load testing is a method used to assess the bearing capacity of a pile by applying a dynamic load to the pile head (i.e. dropping a hammer/weight on the pile from a set height) while recording acceleration and strain on the pile head.
In Australia and Victoria State, Dynamic Load Testing, under AS2159-2009 and VicRoads 608, is sufficient to prove geotechnical capacity of a pile. The foundation bearing capacity results obtained with dynamic load tests, from research, appear to correlate well with the results of static load test, hence they are an approved method here. Piles designed to take large geotechnical design loads and are integral to a structure, are use static load testing as a preferred method; simply because they are more accurate.
A restrike of piles then must be conducted, under VicRoads 605.08, on 10% of piles in the group, not before 24 hours after driving. The idea behind this is to assess whether ‘set-up’ or ‘set-down’ of piles has occurred (i.e. pile capacity has increased or decreased over time). It appears that the most accepted reasoning for ‘set-up’ occurring is pore water pressure related (Q the many hours of John drilling Mr. Terzaghi at us!).
Effectively, as driving occurs, pore water pressures increase around the pile, reducing the effective stresses in the soil and thus the capacity of the pile. The idea of the 24 hours (minimum) time between end of drive and restriking is to allow time for these pore water pressures to dissipate back to pre-driving levels (though I’m not sure how a prescribed time can be used given that, if I’m not mistaken, dissipation of pore water pressures is a function of the soil characteristics?).
In total, 2 piles are tested per group with a restrike. The 2 piles selected are the initial pile that was tested and the pile that recorded the highest set; for those unaware, set refers to the distance the pile moved per the last 10 blows – about 32mm in this case. This ensures the pile mobilising the least resistance in the group during driving is tested (i.e. the pile with least geotechnical capacity – theoretically).
The requirement to re-strike comes about for two reasons. Firstly because, while across my site (Zone 401) it is expected that piles will gain capacity over time, it is possible that the soil might either relax or that the piles heave, resulting in pile capacity deterioration, and the easiest way to confirm that it isn’t occurring is by completing a restrike test. Elsewhere on the project (Zones 402 & 403), restrike is being used to demonstrate that piles are actually gaining capacity over time (set up), where the ground conditions involve deep profiles (31m whereas 401 toe levels are designed to 12m) of cohesive soil which will be ‘failed’ during the pile installation process and will then ‘remould’ over time to provide resistance in the form of skin friction.
The second reason is that it is required under VicRoads 605.08, which states that restrike of driven piles must occur, and not be 24 hours.
When conducting the restrike, I noticed that the Testing Engineer did not start by conducting the test with the full dynamic load (in this case a drop height of 1.5m), instead he started with 0.4m and then struck again at 0.6m before striking at 1.5m; as note, the operators messed this up and accidentally dropped the first strike at 0.9m. The reasoning for starting small is to check the pile does not crack/damage under the stress induced from the dynamic load. Clearly, if superficial cracking/damage can be seen to occur from a lower energy then they will not continue with full drop height. This I suppose is a weakness of the Dynamic Load Test in comparison to the Static Load Test – More chance of damage to piles from the fast impact loading.
PDA equipment calculates the velocity and force signals obtained from accelerometers and strain transducers attached to the pile during driving (only attached to piles being tested). Two identical accelerometers and strain transducers are attached close to the head of the pile on opposite sides and diagonally across; this allows for a better average of results.
The PDA was used to record, digitize, and process the force and acceleration signals measured at the pile head. These signals are used to estimate static capacity using the ‘Case Method’, a simplified field procedure for estimating pile capacity. PDA tests only provide direct measurements for the forces and motions applied at the pile head and are sufficient on their own and the static and dynamic soil parameters and distribution of forces over the pile shaft and toe are not directly measured.
To account for this, a CAPWAP analysis is conducted by an offsite, independent, Testing Engineer. To verify the static component of pile resistance, the CAPWAP analysis is performed on field data from a selected representative hammer blow from the PDA test record. CAPWAP analysis resolves three unknowns: the internal pile forces, pile motions and external forces. It is far more detailed than a PDA test. However, it requires expertise and experience as soil characteristics and ground water must be entered accurately; this requires judgement of the engineer.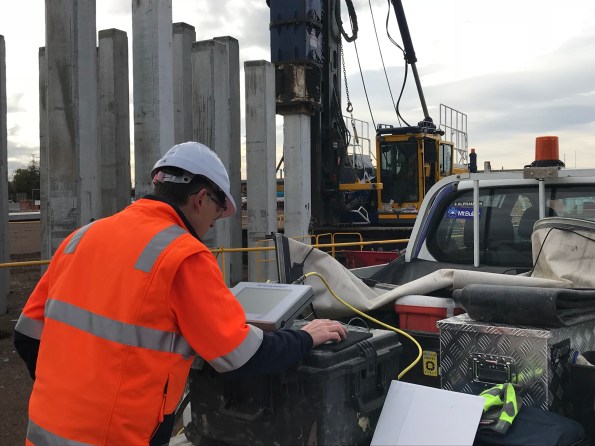
I’ll look to get hold of the CAPWAP results and consult with the testing engineer to see how the design, PDA and CAPWAP results compare once the piling has started at 401 to further understand!
On another note, the weather is looking much better back in the U.K. at the moment – you can’t stay on the beach past 5pm now ….
