Archive
Oz PCH – Fire & Smoke Management Cause & Effect: Technical and Commercial Issues.
Introduction
This blog highlights the commercial impact of a technical issue that can spread across many levels and affect multiple subcontractors/parties.
This could be yet another contracts management exam question.
It also covers next steps in fire cause and effect design development and testing and commissioning.
Issue
Reviewing the fire and smoke management cause and effect matrix highlighted some potential issues for the mechanical equipment; namely fans and dampers. Centigrade, mechanical fit-out subcontractor, had to install 72 x additional smoke dampers (electronically controlled) in various fire zones across the project. 10 x original dampers have been removed so the actual delta is 62. This was due to the initial design drawings by NDY, design consultancy, not reflecting departmental design changes.
Schneider, controls subcontractor, didn’t know about the additional dampers which now presents a serious technical issue; the ability to connect each new damper to a controls board. This throws up lots of detail like; have all the walls and ceilings in those areas been closed? Where is the connection point for the cables? Etc, etc.
Why didn’t Schneider know? Whose responsibility was it to inform them of the design change? From a technical stand point Centigrade has to have their new smoke damper design approved by NDY. Whether design consultants like to officially approve a third parties’ design is another matter; usually they don’t and won’t in case things go belly-up. However, they should at least review and comment on it. This design review information is then sufficient for them to either pass on to those who need to know about it; in this case Schneider, or at least inform the managing contractor, JHG; or ideally do both. So what actually happened? Nothing! This has led us, the commissioning team, to get involved in design – which clearly isn’t/shouldn’t be our remit. This situation reinforces NDY’s alternate acronym; Not Done Yet.
This type of ‘interface verification’ to use the commissioning vernacular for a scope gap between two or more subcontractor’s works meeting, seems to be a recurring issue in a number of areas across the project.
Solution
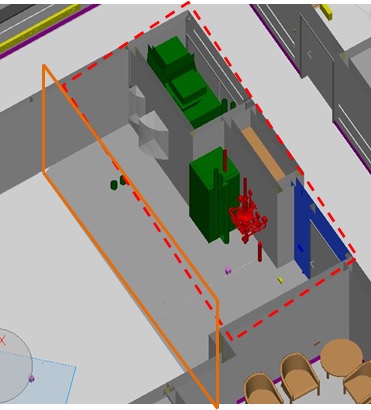
In order to find a technical/operational solution, to get the system working and to a commissionable state, we must now conduct a desktop study and understand exactly how many, including the exact location of the additional dampers, require wiring into Schneider control panels. Figure 1 was used to help explain how to go about this; splitting project areas into fire zones and then annotating drawing schematics with additional dampers to then understand the best possible wiring route to Schneider’s control panels. Figure 2 shows the cause and effect matrix as intended by NDY. It requires cross referencing against updated fire and smoke zones according to as-built architectural drawings. The trade contractors can then work through the detailed design of their individual dampers (smoke, fire, and smoke-fire). This then all needs to be reviewed and approved by NDY; which JHG will be insisting they sign-off on.
Figure 3 is the printed version which you can see is a pretty big beast. This is only the mechanical equipment with similar sized spreadsheets for miscellaneous equipment interfaces such as; hydraulics, lifts, medical gas, AGVs, security doors and PA alert system.
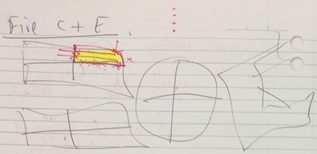
Figure 1. Smoke Damper Desktop Study Example.
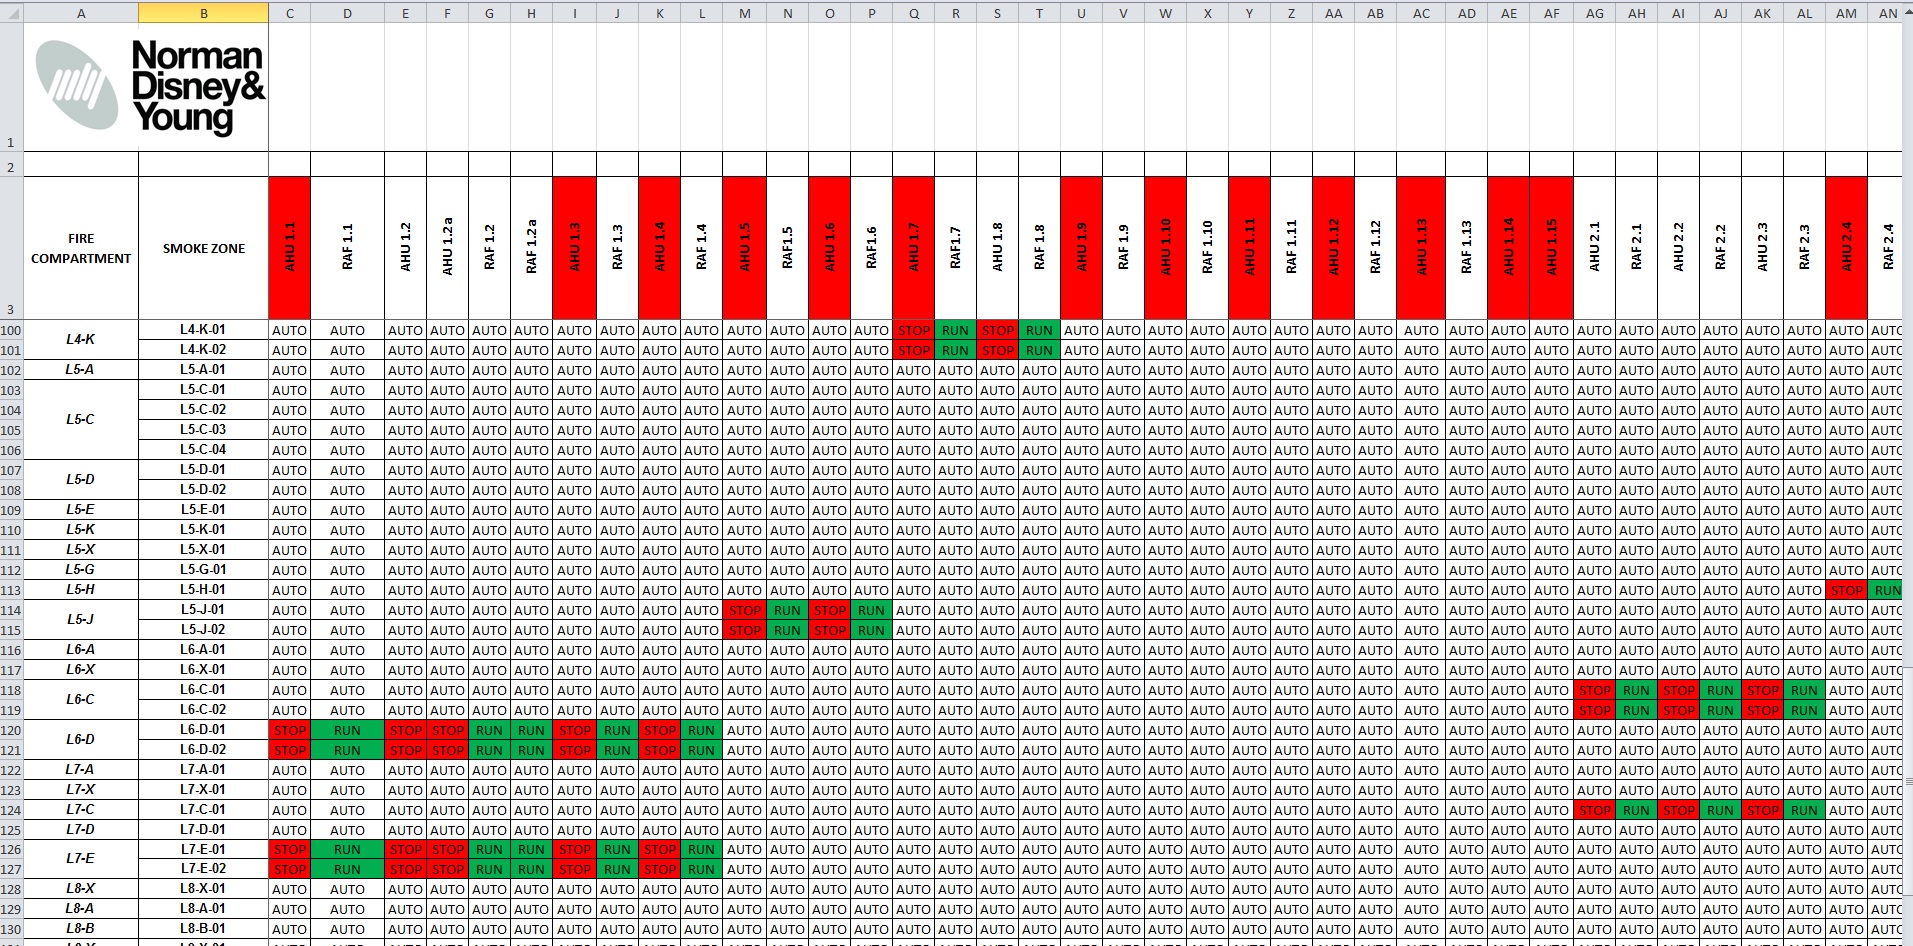
Figure 2. Excel Screen Shot of Fire Cause & Effect Matrix.

Figure 3. Print out of Fire Cause & Effect Matrix.
Commercial Implications
Commercially, this will open a can of worms; Centigrade will be putting in a variation order for their additional smoke damper design work; and Schneider will follow suit for their additional controls cable to said dampers. JHG will then no-doubt pass these straight to NDY as it was their inadequate design that caused the issue.
Playing devil’s advocate; NDY will most likely say the reason additional smoke dampers were required was because Fredon, plantroom mechanical fit-out subcontractor, changed the layout of some of their AHUs in the plantrooms. And here’s the irony; why do you think Fredon had to change the layout? Correct; because NDY also poorly designed that area too.
In terms of project contractual relationships; JHG being the managing contractor have a very ‘thin’ level of management that sits above the subcontractors and consultants (see figure 3). This means that issues of communication, as in this example and many others where subcontractors need to talk to each other, have to be managed carefully – which unfortunately on this project, due to the ‘thin’ level of management, isn’t all that great.
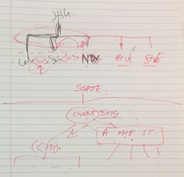
Figure 3. Contractual Relationships.
Design Development
The issue discussed above should have been solved months ago. Remembering we are in the testing and commissioning phase and our remit is to conduct just that, but we have found ourselves having to develop the design first. We have had to set up a workshop to ‘war game’ a few example areas to; a) prove NDY’s Cause and Effect Matrix, b) add in any additional dampers as a result of fire and smoke zonal changes and c) ensure these additional dampers get the required power/controls to operate. Once the subcontractors understand how to develop the design (which still lies with NDY), NDY will then review and approve.
Testing & Commissioning
This will involve using the revised cause and effect matrix to test each and every fire and smoke zone across all levels; a pretty mammoth task. Without going into too much detail, the detailed fire engineer design report stipulates test methodology and what pressures we need to be within. As outlined in the report and from AS 1668.1:1998 The use of ventilation and air-conditioning in buildings – Part 1: Fire and smoke control in multi-compartment building; it states “positive pressure not less than 20 Pa and not greater than 100 Pa shall be developed in all non-fire-affected zones above the pressure in the fire-affected zone…”
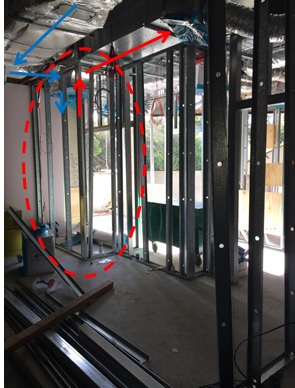
The air-conditioning system and controls interface aims to achieve this pressure gradient by a combination of; stopping the supply air and ramping the extract/return air in the fire-affected zone (to create negative pressure) and then ramp the supply air and stop the extract/return air in the adjacent non-fire-affected zones (creating positive pressure). The 100 Pa maximum is stipulated to ensure doors can be physically opened by escaping occupants. Figure 4 shows an example of the fire and smoke zone drawings being used in conjunction with the subcontractor’s shop drawings to identify the location and type of damper in place and establishing, using the cause and effect matrix, if the actual as-built layout can achieve the design intent. This was a dry run of how we intend to run our workshop.
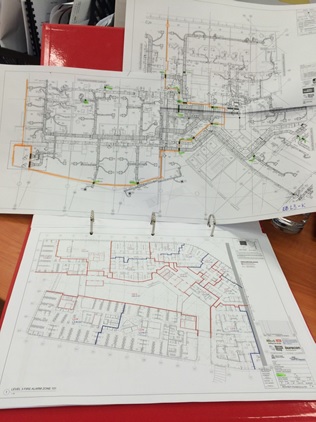
Figure 4. Fire and Smoke Zone Drawings and Subcontractor’s Layout Drawings.
Potential Issues
A number of issues can arise from the testing which I will blog about separately if and when encountered; if I’m not already on Phase 3 and here to witness them that is. Generally they will be things likes; can we achieve the 20 Pa min pressure drop across the fire zone doors? Can we rely on extract/exhaust alone to create the pressure gradient? This could be a requirement due to the outcome of integrated scenario testing where an electrical power failure has occurred, simultaneously with a fire starting. The back-up generator and UPS system will only provide power to essential and critical-essential supplies and not non-essential. Unfortunately, a number of the AHU supply fans are powered on the non-essential supply and so if lost to a power outage cannot play their part in zonal pressurisation. There will be other potential issues concerning building fabric air-tightness throughout the building but particularly regarding smoke walls that dissect a fire zone. These will have motorised smoke dampers but still require adequate sealing to avoid smoke spill. There will also no-doubt be other potential issues specific to certain areas of the building like staircase pressurisation and the like.
Oz PCH – Chilled Water (CHW) Pipework Flushing.
Introduction
Usually once all CHW pipework has been installed in all plantrooms and throughout the whole network this is when the commissioning process of flushing and cleaning commences. However, on this project Central Communications Room 2 (CCR2), which houses all the communication equipment and creates a large heating load, was required to be switched on early. Therefore the heat load required to be controlled and cooled so the decision was made to use the intended CHW system to do this; however, there were a number of plantrooms still under construction with incomplete pipework. The work around was to shut off the isolation valves from the lower basement to the rest of the building and using the intended CHW main pump room (plantroom 10) flush and clean that part of the pipe network. This meant that we could then open up the isolation valves from the Central Energy Plant (CEP), which provides CHW to the entire Queen Elizabeth II Medical Centre (QE II MC) site, and provide the CHW required for CCR2.
So What?
In doing this and maintaining the CHW from the CEP through plantroom 10 to cool CCR2 it meant that when the remaining plantrooms and CHW pipework was finally installed that part of the network would have to be flushed and cleaned separately to avoid contaminating the lower basement pipework that has already been cleaned and is operational but more importantly avoid contaminating the CHW system from the CEP which also feeds the rest of the QE II MC site.
The Solution
It wasn’t possible to shut down CCR2 and so the only solution was to flush and clean the remainder of the network in bit-part fashion – not ideal or the way it should be done. Why? Because it meant that we could no longer use plantroom 10 main pumps and instead had to get the subcontractor (Fredon) to use a stand-alone flushing rig (with its own pump set). The intention would be to flush and clean each plantroom separately back to the point of the lower basement isolation valves.
The Issue
The first plantroom to be flushed (plantroom 7) was set-up with the flushing rig and ready to go when disaster struck. The armoured flexible coupling from the rig to the pipework had an epic fail and flooded the plantroom. Fredon informed us that the flexible hose burst off the flanged collar under the pressure (3 bar) and volume of water. BSIRA guidelines state:
The specified minimum flushing velocity should be that indicated in the table (figure 1), or the design velocity plus 10%, whichever is the greater. The flushing velocity must be selected based on the largest pipe size in the system or circuit to be flushed.
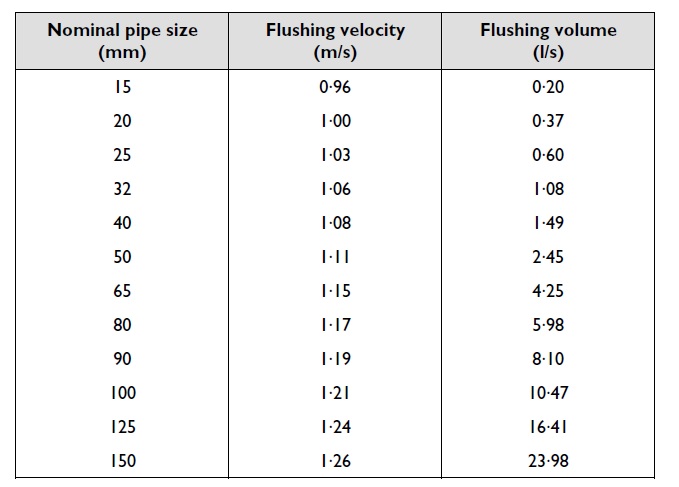
Figure 1. Minimum water velocities required to move 5 mm diameter steel particles in horizontal medium grade steel pipework (BSRIA).
So for a pipe diameter of 150 mm the flushing velocity should be 1.26 m/s with a flow rate of 24 l/s to flush out a particle size of 5 mm in diameter. The test rig was actually set at 27 l/s which equates to 1.42 m/s (at 150 mm pipe) which is over the velocity in the figure 1 table. Figure 2 shows the flushing rig and figure 2 the rig’s flanged connection end and butterfly isolation valve.
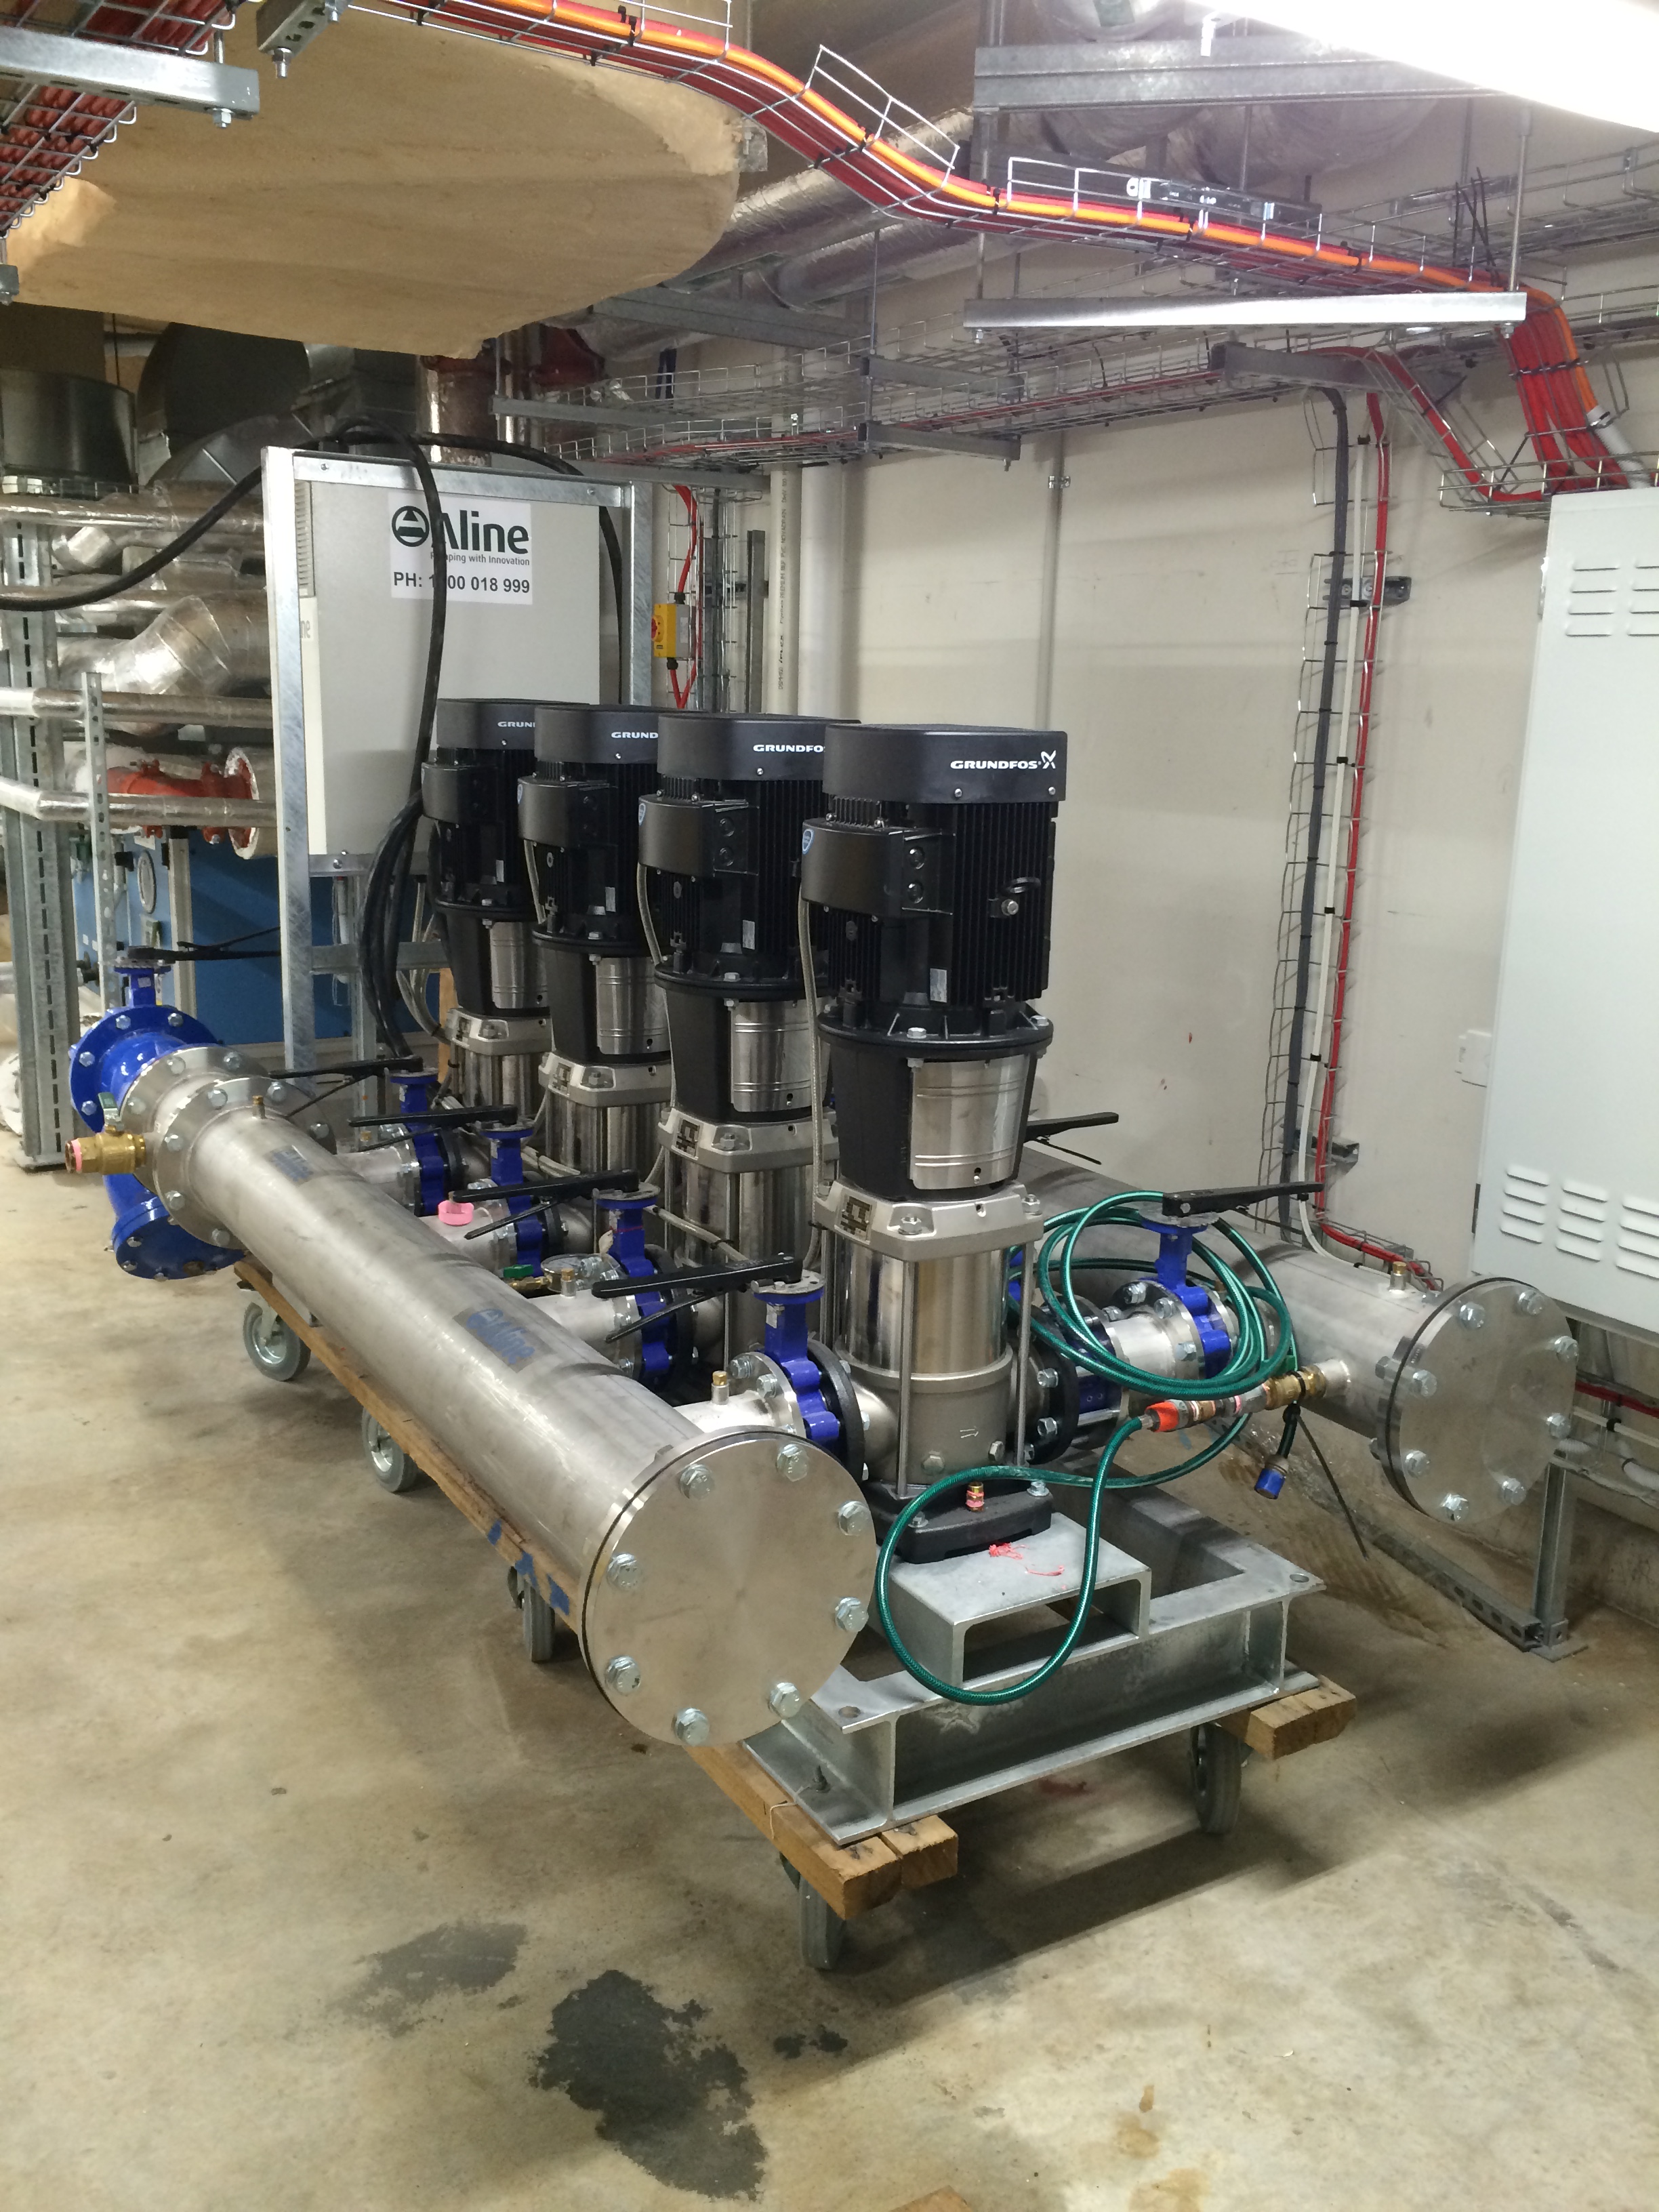
Figure 2. Fredon’s Flushing Rig.
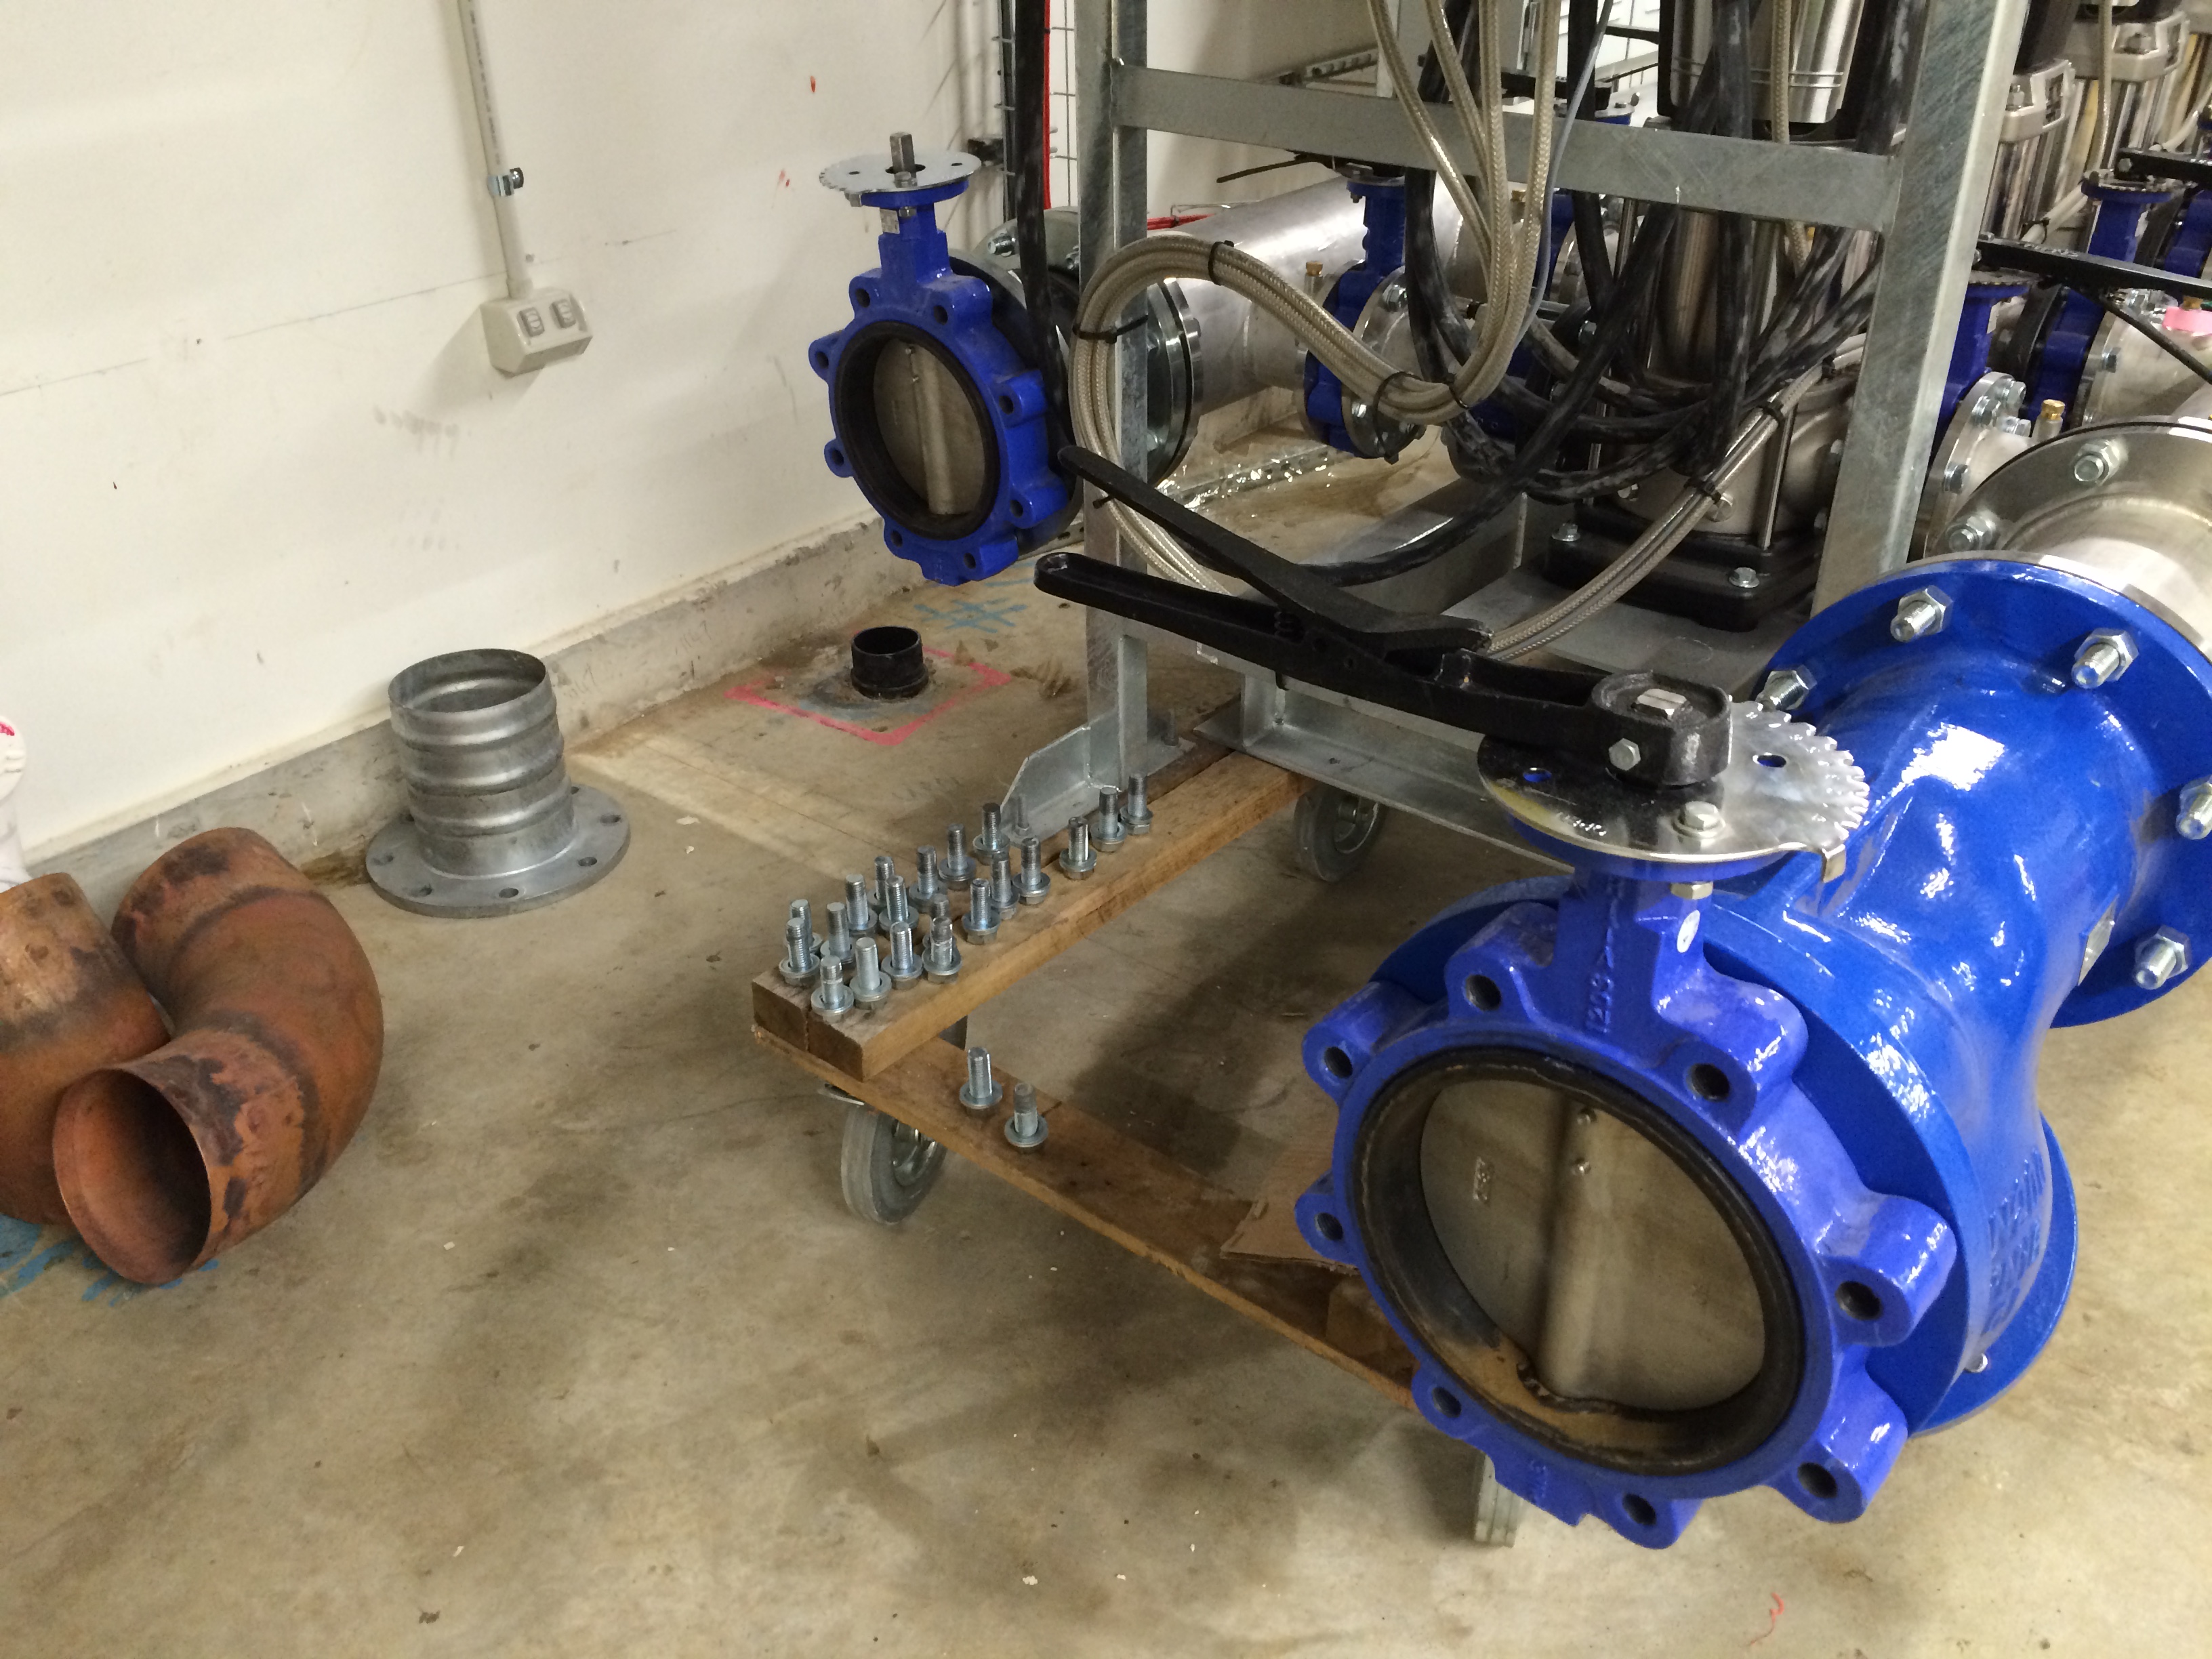
Figure 3. Flushing Rig Flanged Isolation Valve.
Fredon say that the two securing bands (like a large jubilee clip) must not have been tight enough as supplied by the hose manufacturer and under the weight and pressure of the water bust it off the collar. You can see the collar in figure 3 (circled red) but the hose had already been removed from site to be tested where it can’t do any more damage. Fredon gave it another go, after tightening the bands, but it popped off again. Their solution was to use a ‘hard’ coupling using 200 mm diameter copper pipe (figure 4). This removes the flexibility and ease of connection to the rig and means that until the flexi hose is proved fit for purpose every plantroom will most likely need a separate set of copper coupling dependant on the network connection outlet heights and accessibility – hence the preferred flexi hose method. Figure 5 shows the network connection flow and return points reducing from 200 mm rig pipe diameter to 150 mm system pipe diameter.
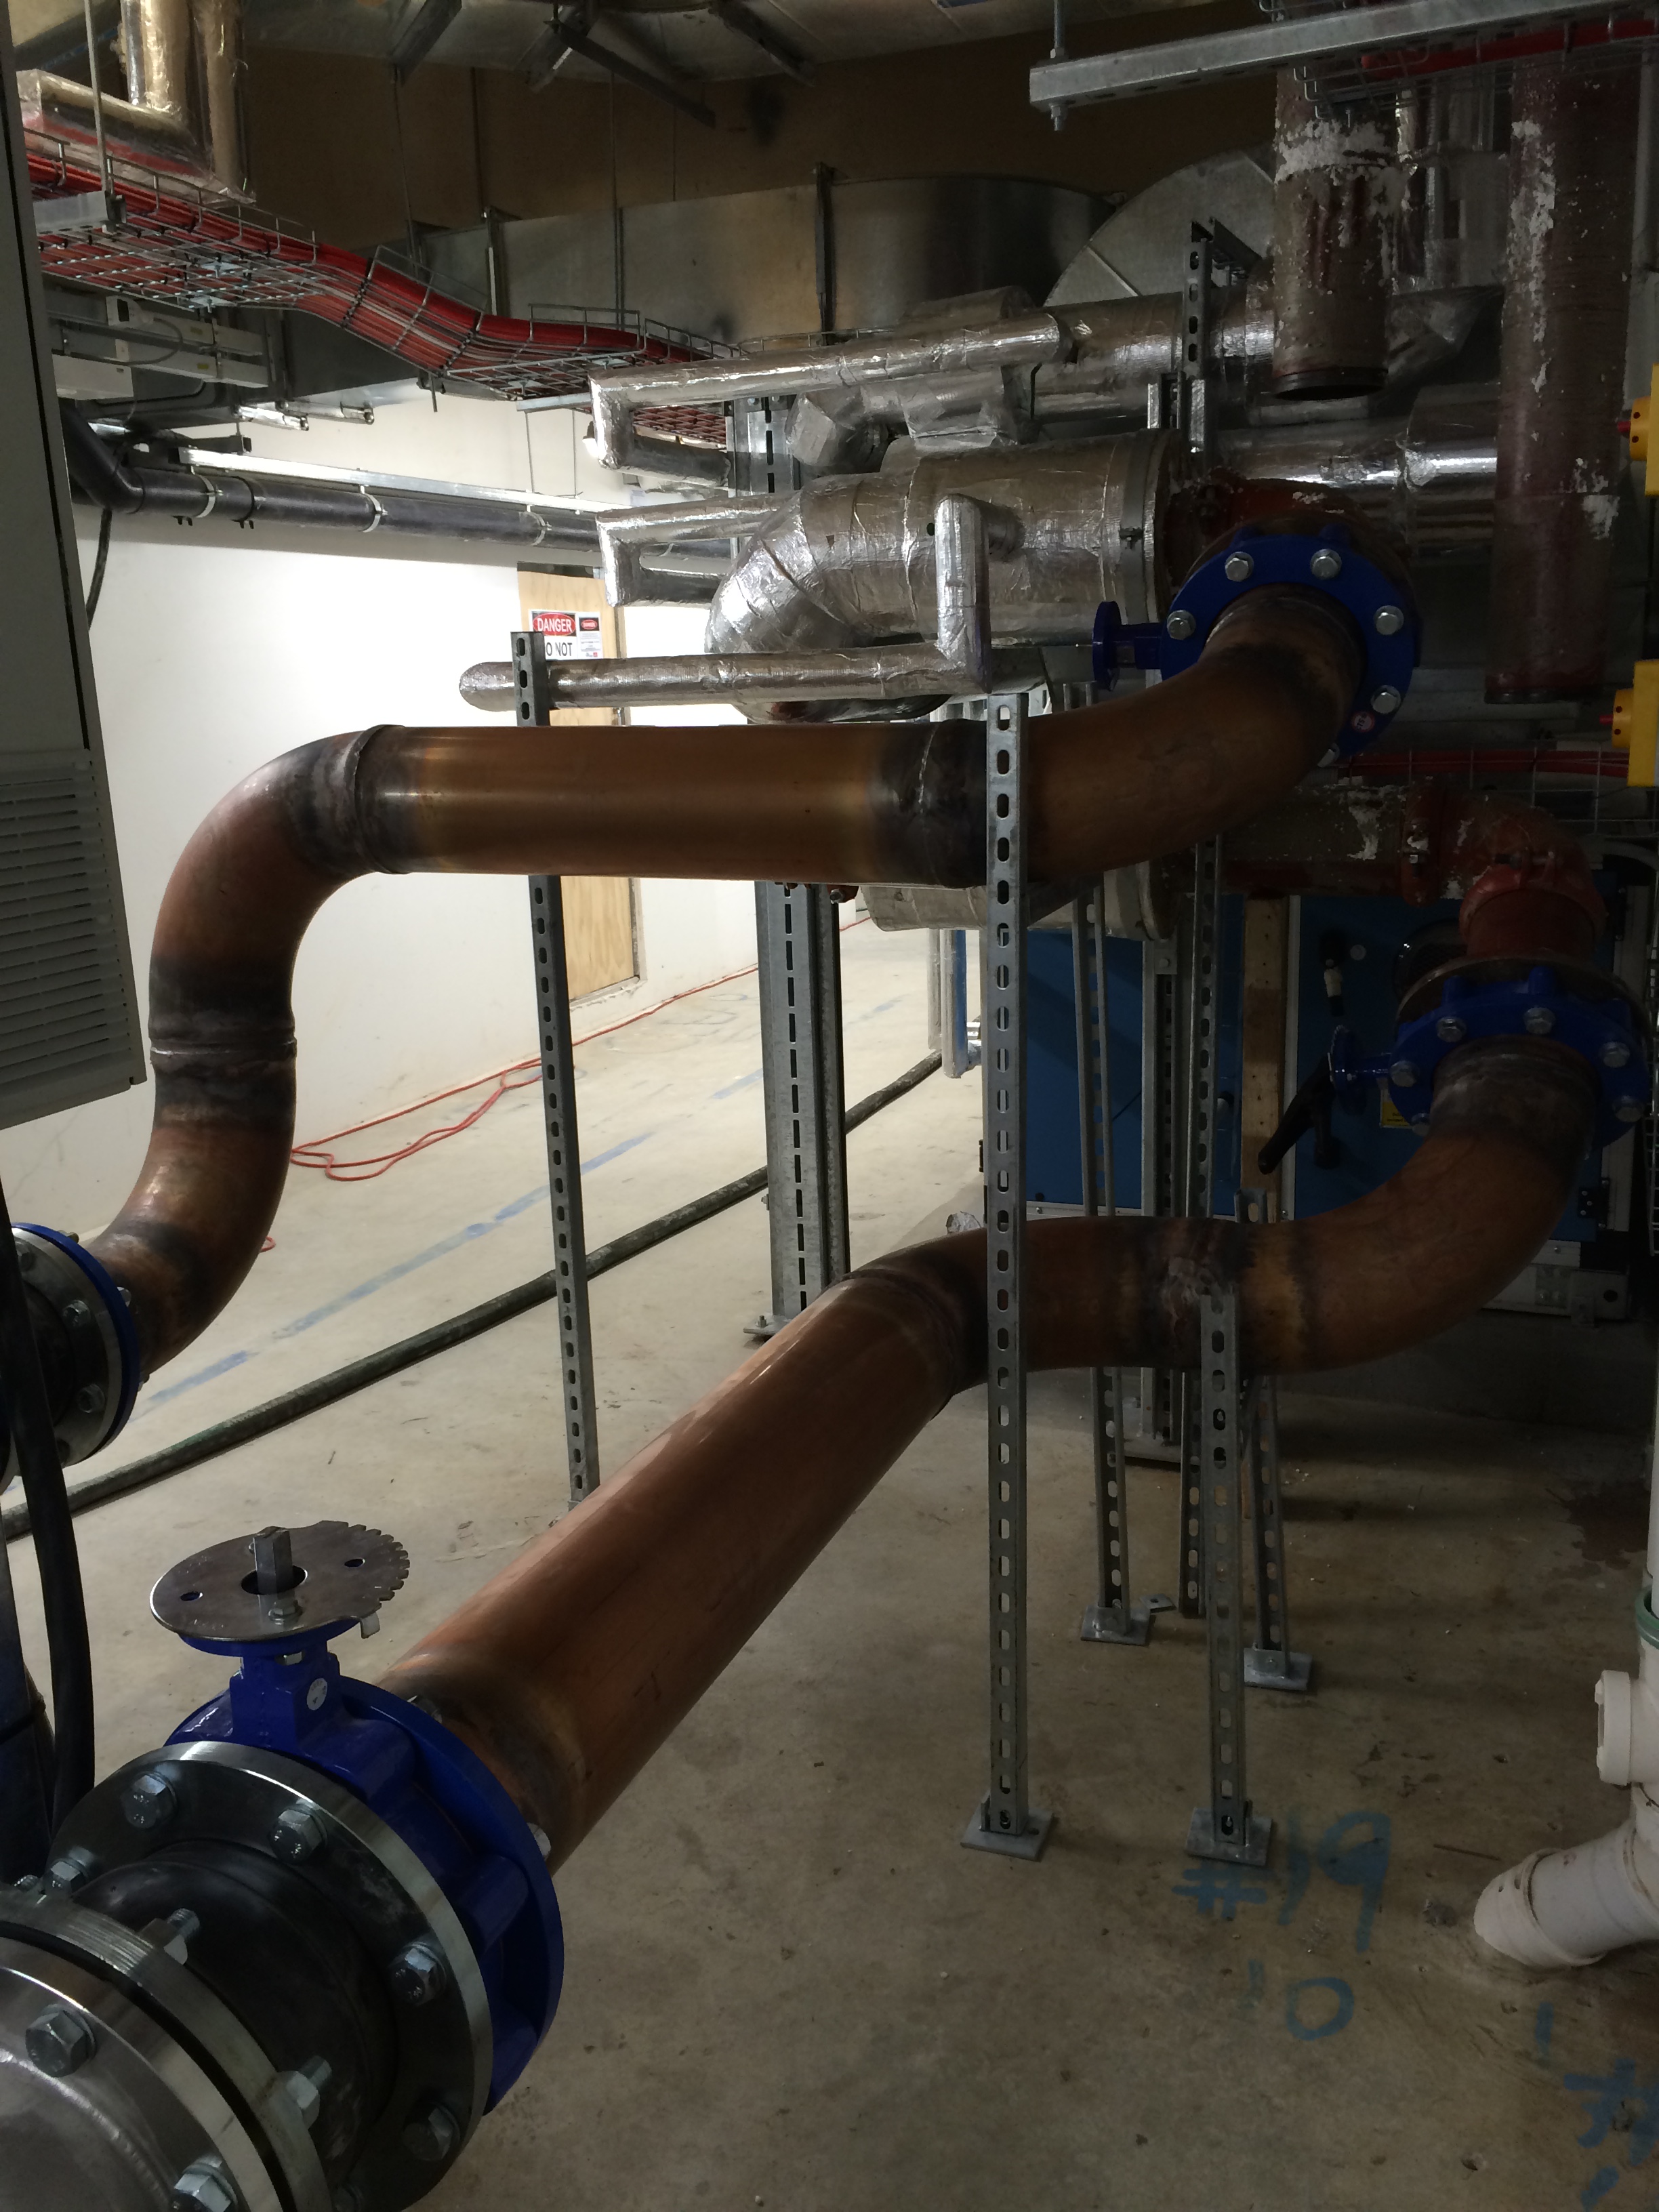
Figure 4. Rig Hard Copper Coupling.
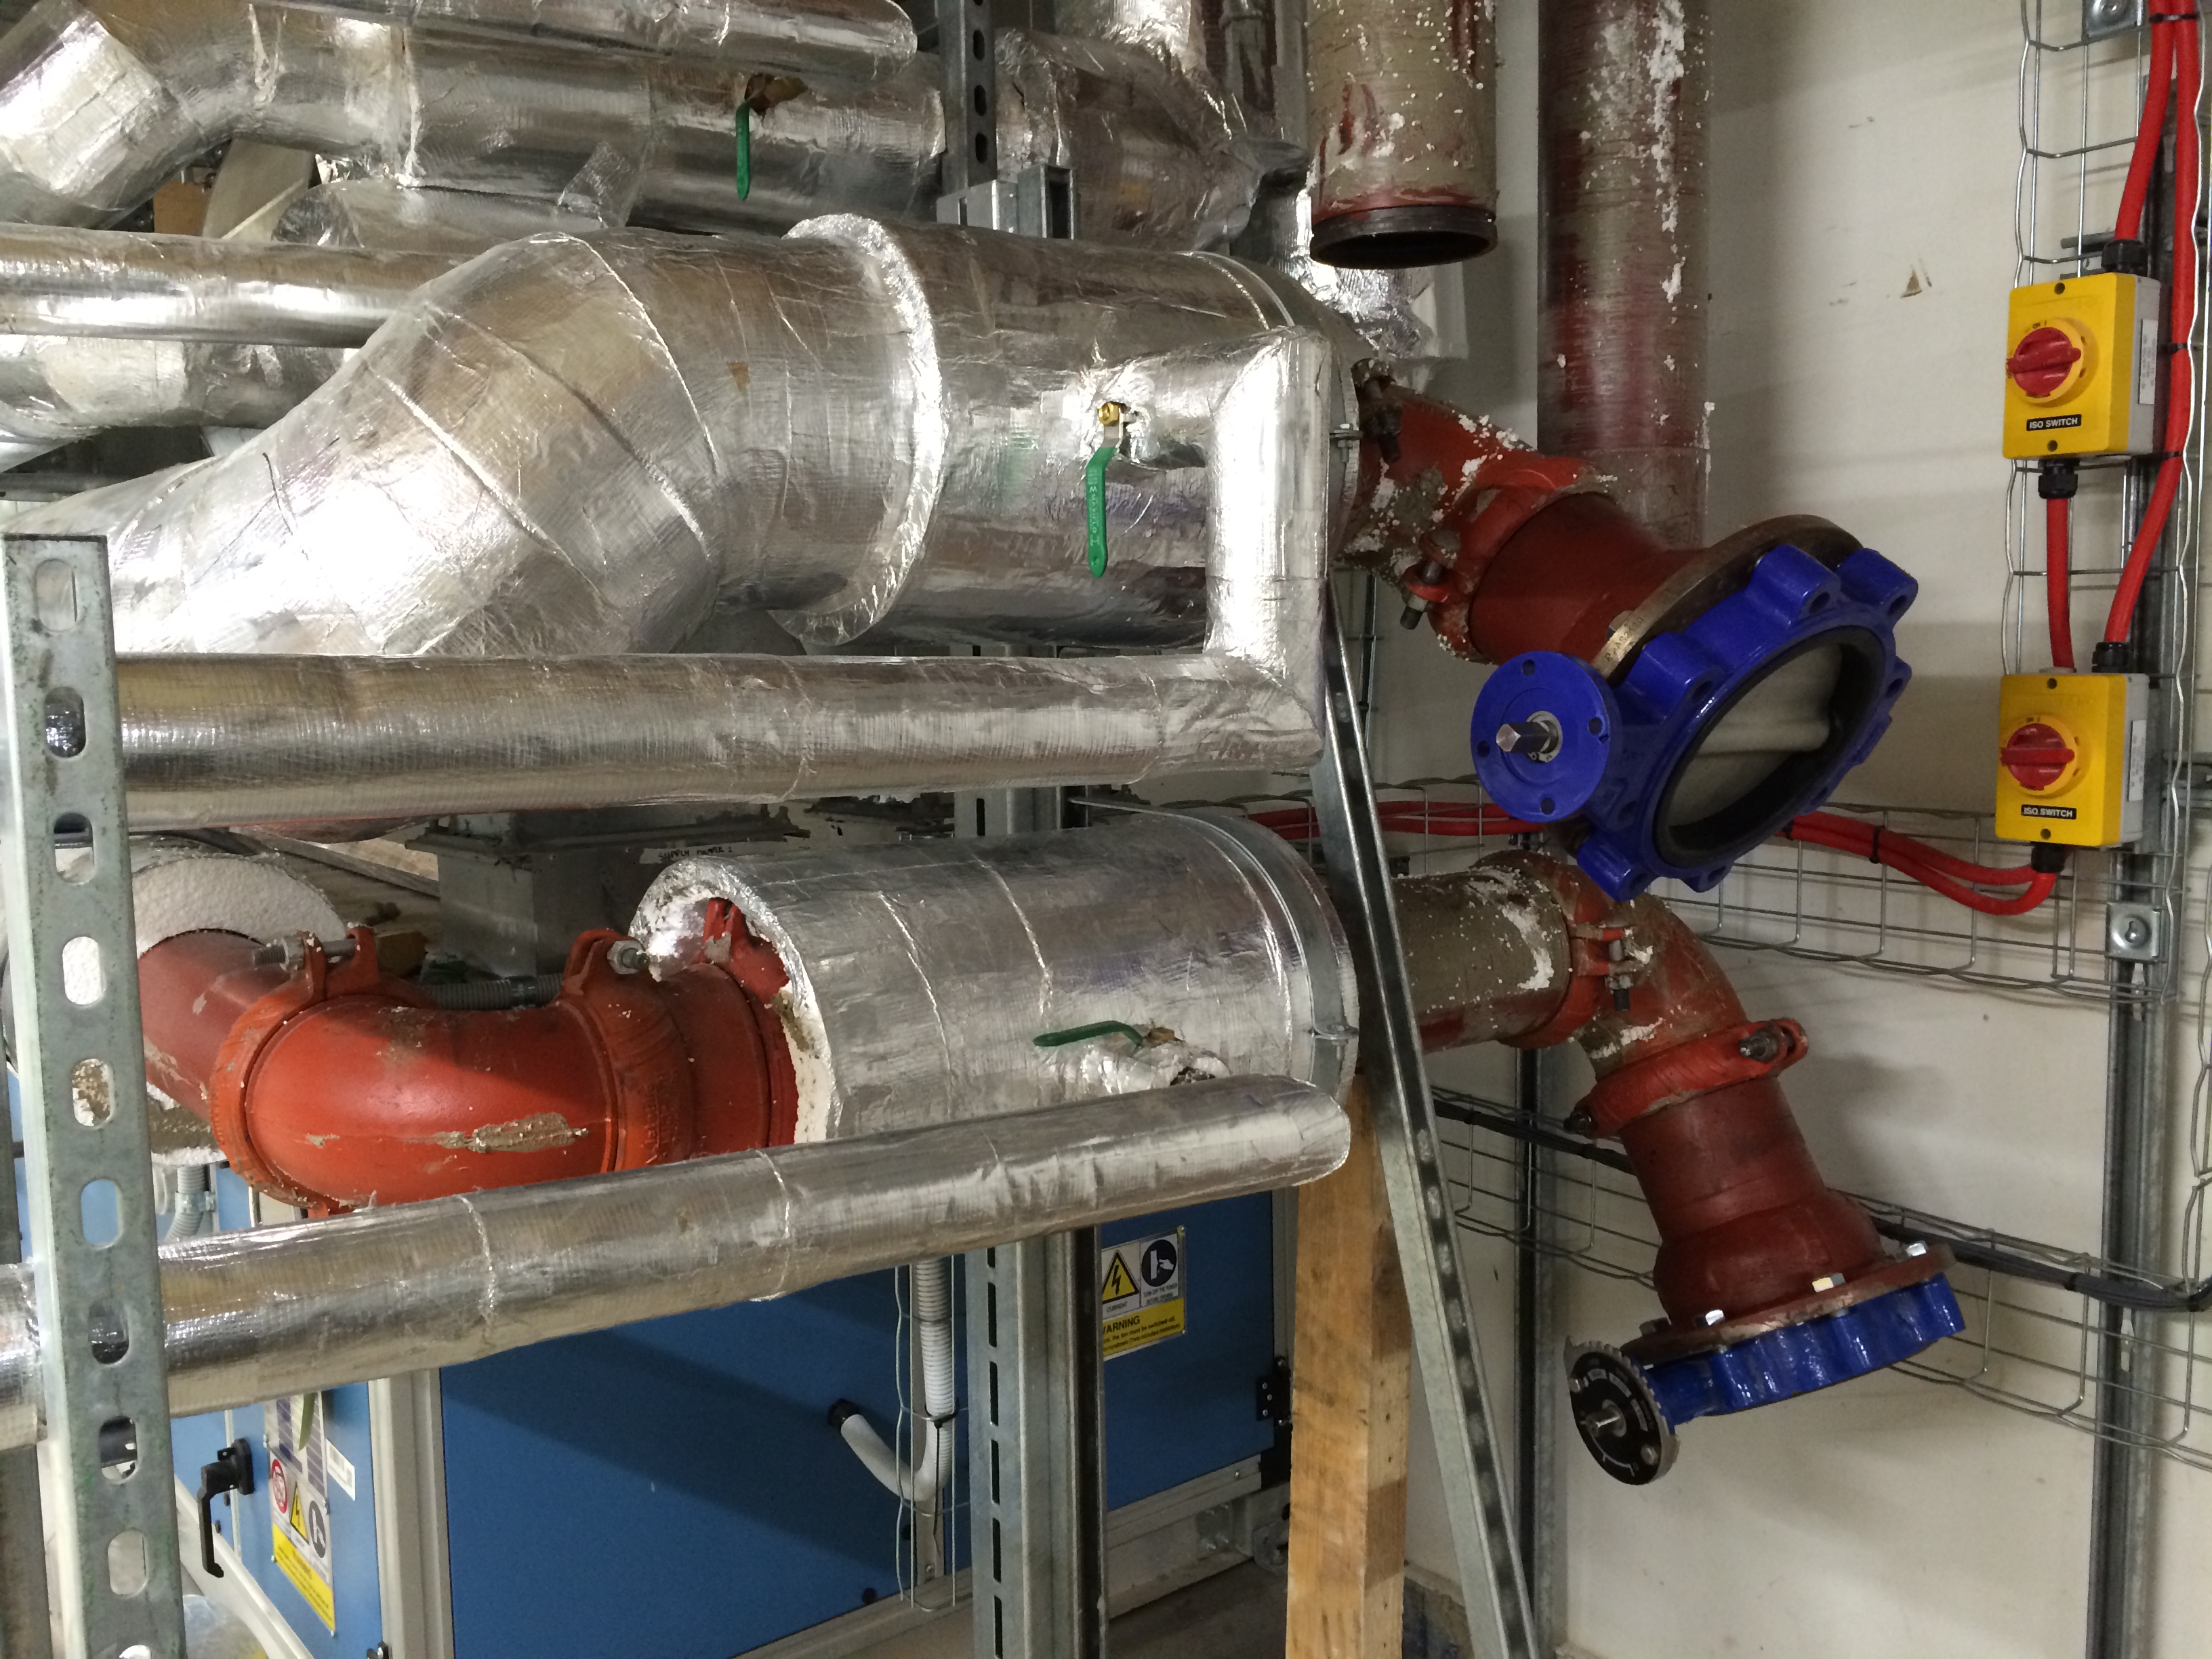
Figure 5. Plantroom Network Connection Points.
The Damage
Figure 6 – 8 shows the damage caused from the flooding. It doesn’t look like much but water being water will find its way into every gap possible. To add insult to injury the plantrooom floor hadn’t yet been sealed water tight so water ran between the gaps where, ironically, the drainage pipework stacks are fitted into the concrete slab and came through to the ceiling of the level below damaging some ceiling tiles and insulation.
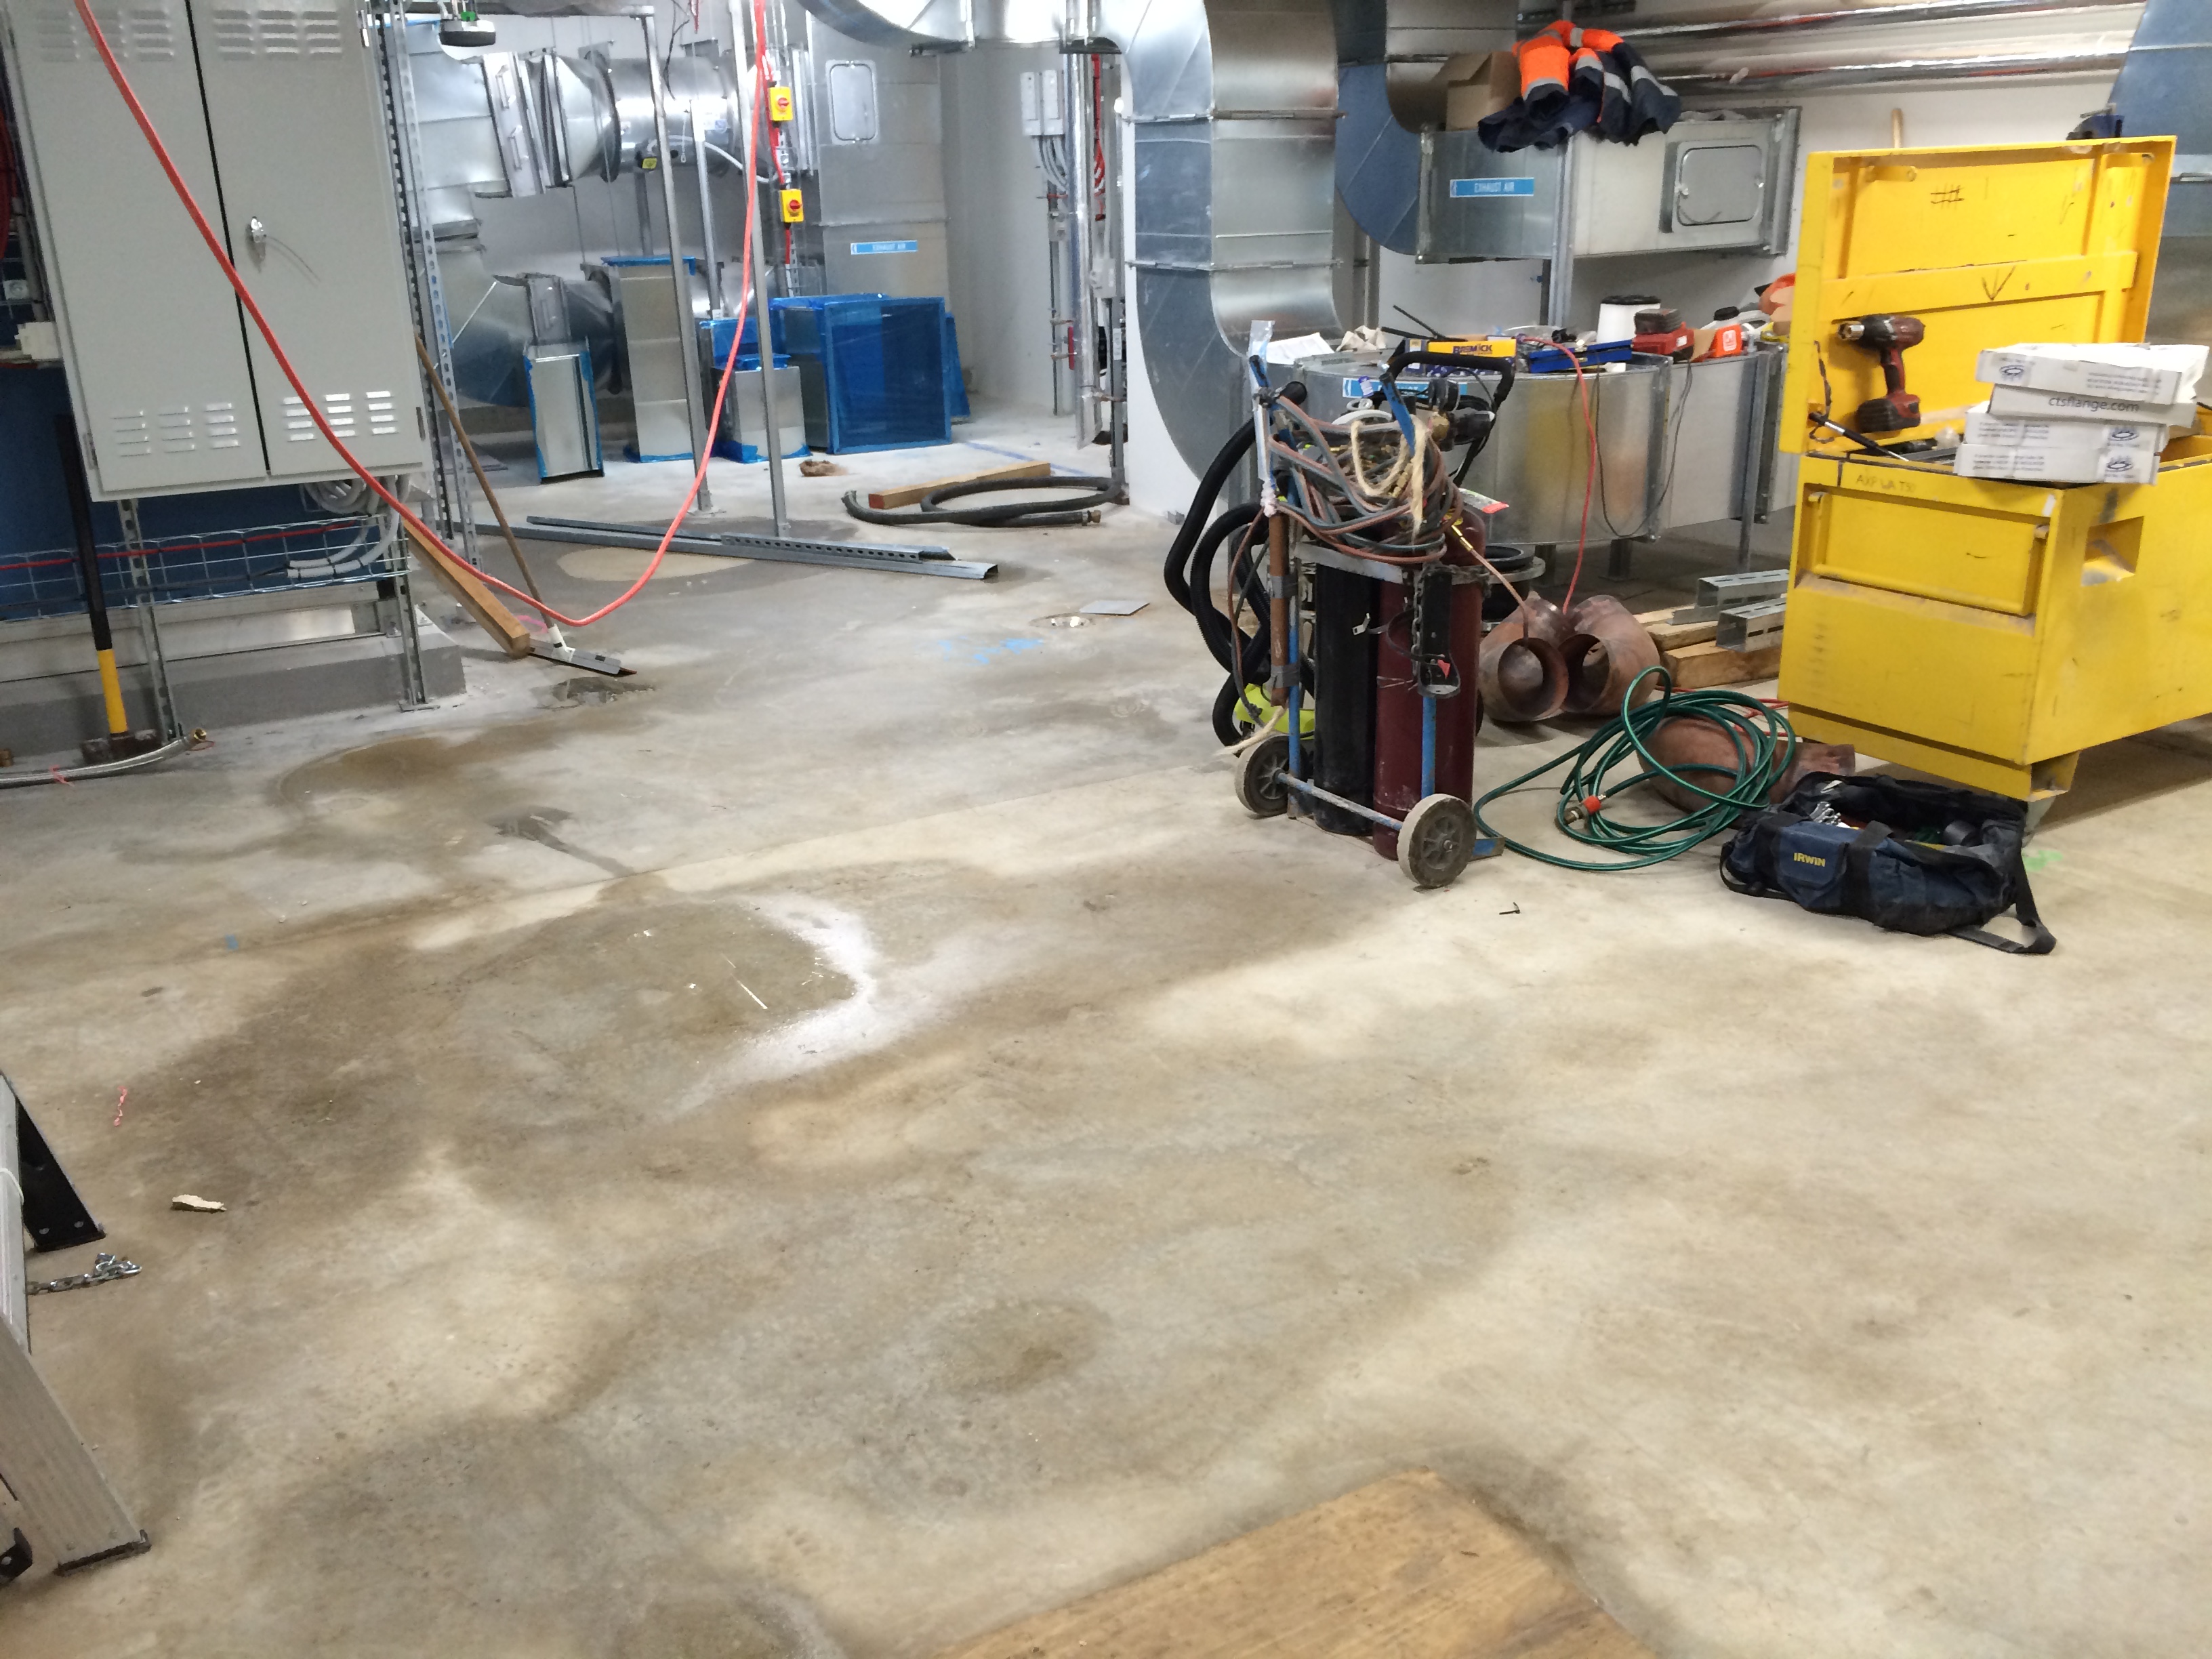
Figure 6. Plantroom 7 Water Damage.

Figure 7. Drainage Stacks.
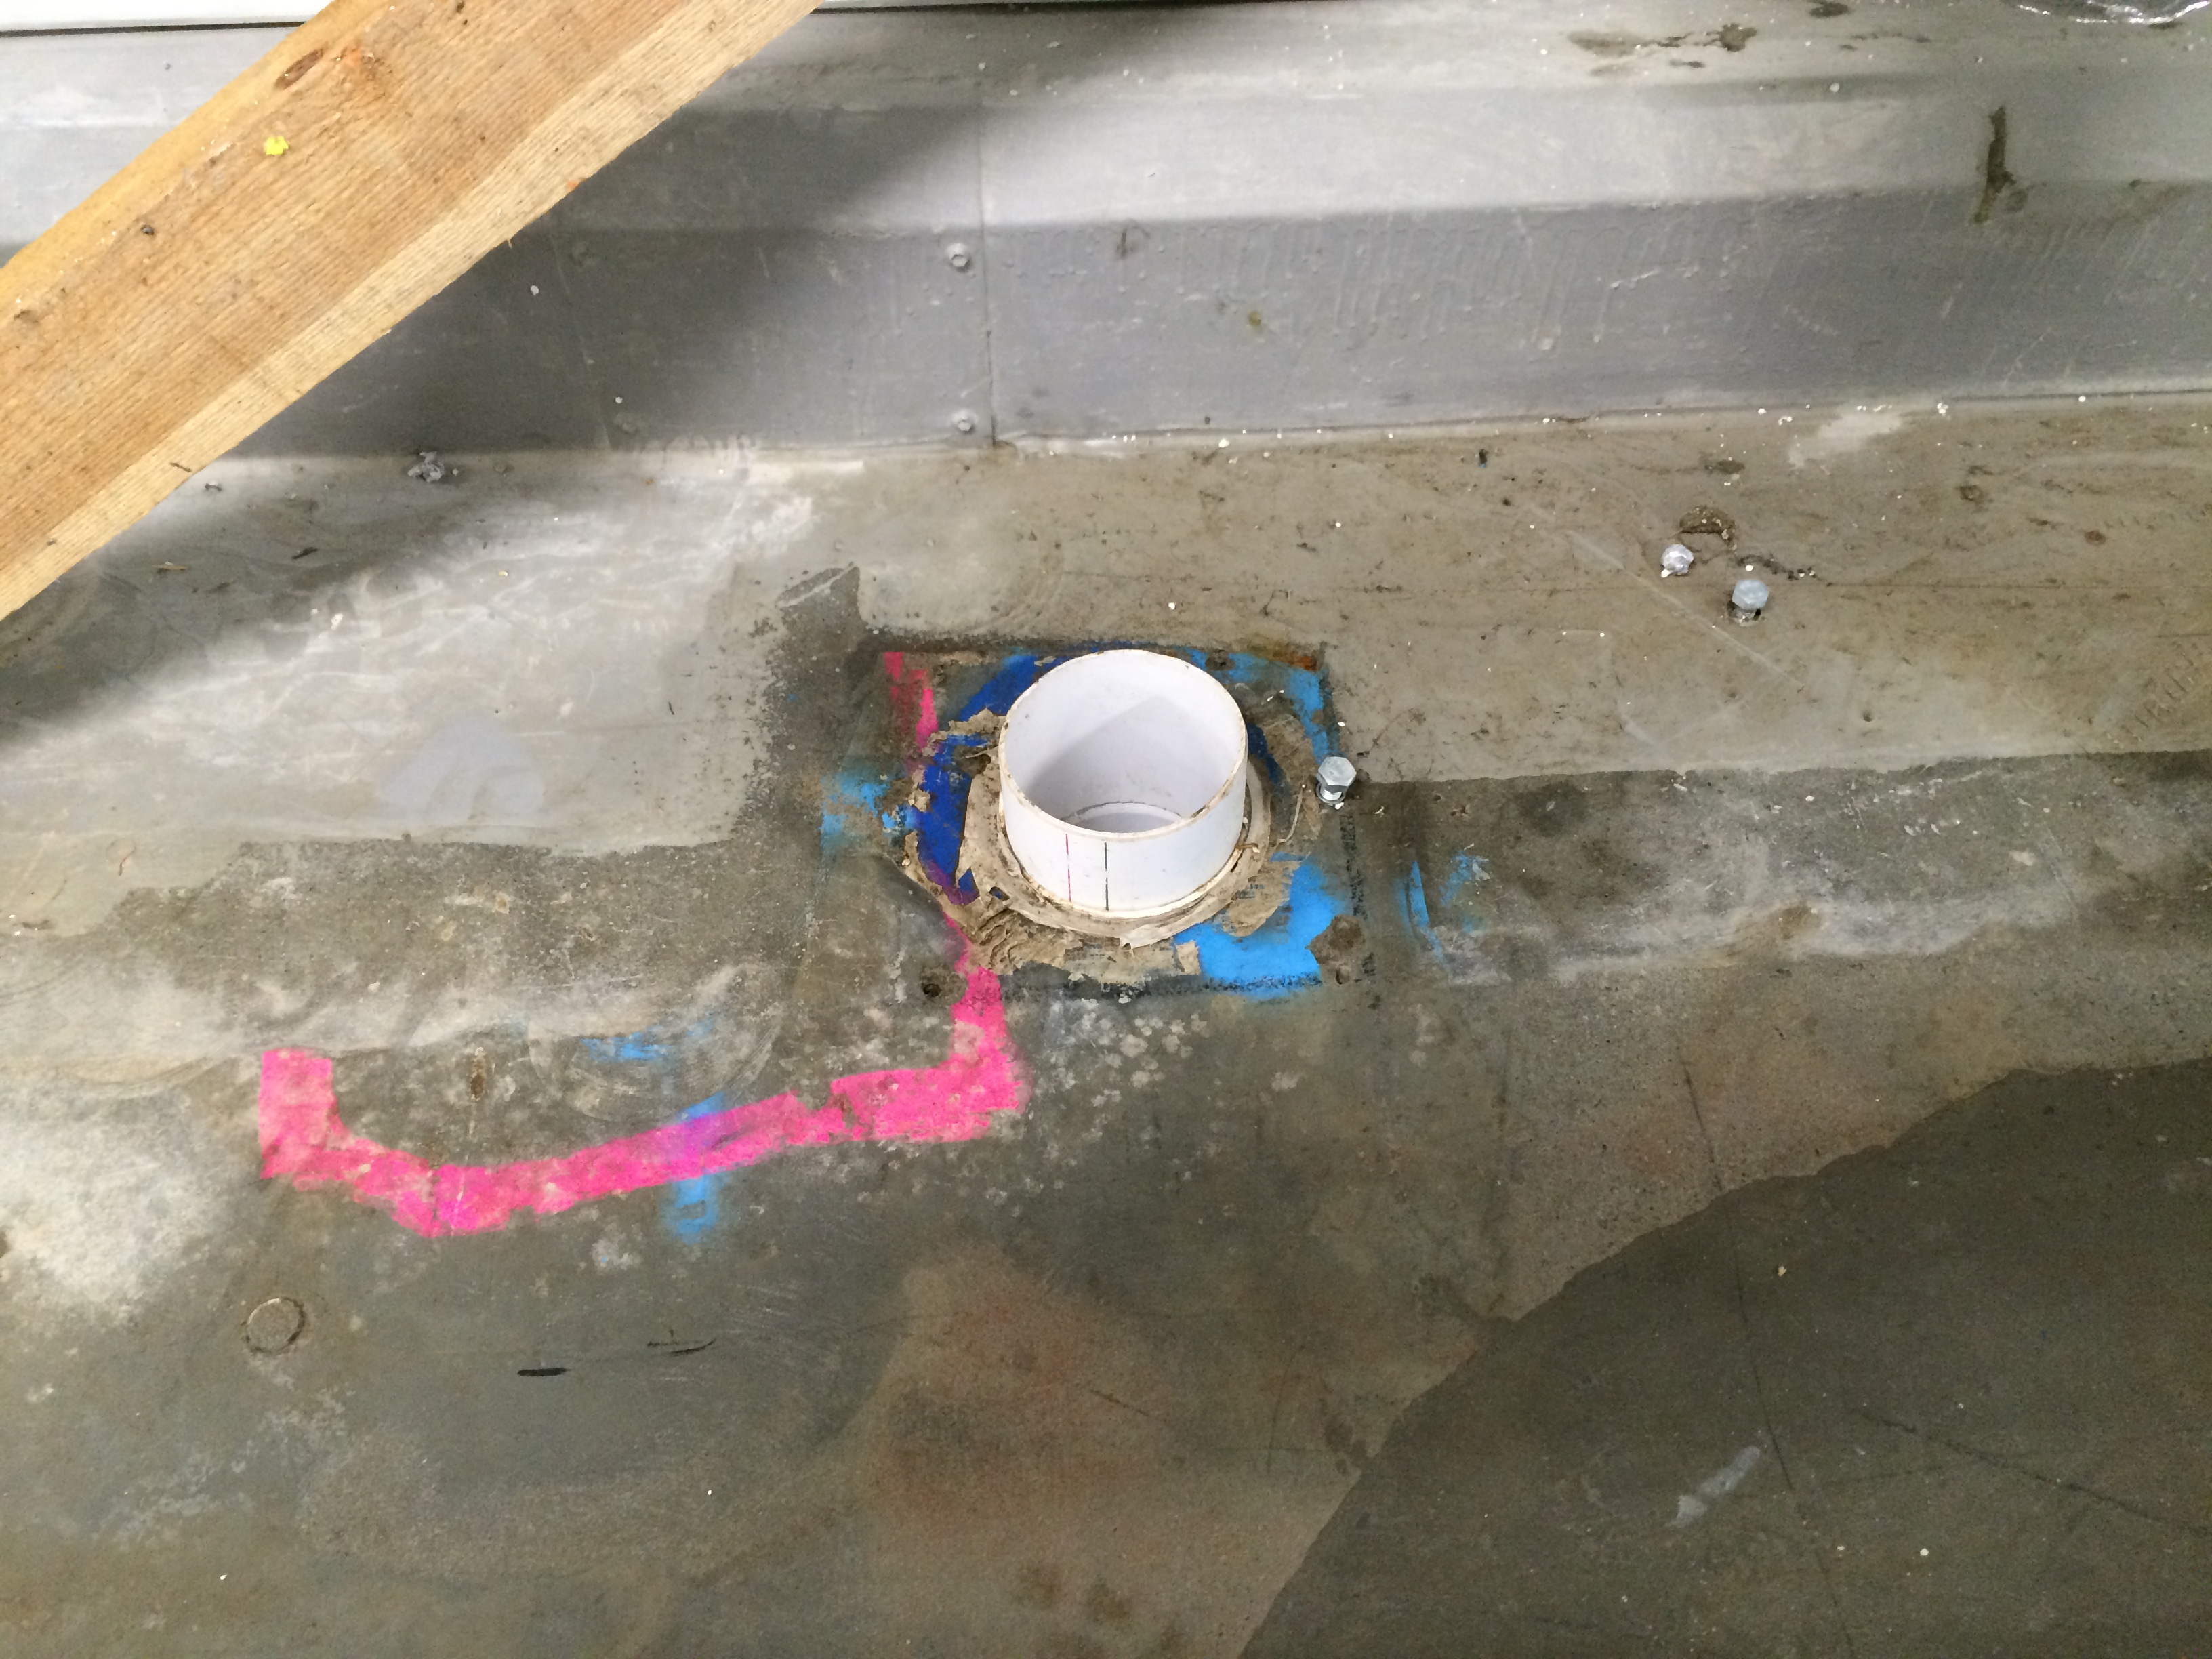
Figure 8. Tundish Drainage from AHU.
Additional Potential Issues
There are also potential issues of someone accidently opening an isolation valve between a plantroom and a riser feeding into the lower basement circuit and therefore, if not flushed will contaminate the CEP.
A second order affect is the Floor Control Rooms (FCRs) which house some IT infrastructure. They aren’t operating at full capacity yet so only a small percentage of the heating load is being seen. Due to this small load these areas still need to be kept cool and so the FCRs on the floors that have CHW supplied are flowing through Fan Coil Units (FCUs). The issue is that because the BMS is not yet fully operational the motorised control valve fitted to each FCU cannot be adjusted. And even with the double regulating valve of each leg manually turned down to the minimum setting the CHW in the FCU is around 6 ºC. So What? This is causing condensation issues where the temperature in the FCR is getting close to the Apparatus Dew Point (ADP) of around 14 – 15 ºC and compounded by the high humidity as the external façade hasn’t been installed in that area yet. This will only get worse when the outside temperature begins to rise and cause an even greater ∆T between the FCR and outside. The condensation could build to the point where it forms bigger water droplets and drips onto the IT eqpt thus potentially damaging it. Therefore this requires swift resolution; most likely in the form of either getting the BMS up and running or introducing temporary heating.
Conclusion
At the heart of both of these issues was commissioning the CHW system in bit-part and not all off the main pumps in one go. However, it was deemed more important to get the CHW system partly operational to cool CCR2. I would have thought another way of providing cooling could have been done through temporary FCUs placed in CCR2. Another conclusion is that floors should be water sealed prior to any pressure testing or flushing in order to limit damage caused by potential leaks. This issue also highlighted that there should have been localised bunding put in place like there is in other plantrooms. Consequentially Fredon’s flexi hose failed its off-site pressure test and so they have continued to use the copper hard coupling throughout the remaining flushing of plantrooms across the project.
Oz PCH – Bomb Shells and Project Roles and Responsibilities Update.
Introduction
Almost at the half-way point through Phase 2 and having covered a lot of ground since AER 1, I thought I’d share the shaping (mostly by me) of my attachment. With regular DAP progress mtgs with my LM, the latest of which (17th July) the Building Services Director sat in on, he decided to drop a small yet not insignificant bomb shell – he has done his best Judas Iscariot impression by handing in his notice to leave JHG (in a month) to work for Westfield Construction (shopping centres). Not good news considering we are in the middle of commissioning, with issues popping up every day, and he is the Commissioning Manager!
The week prior we (the commissioning team) had a re-alignment of project roles and responsibilities. Interestingly my LM still had a hefty work load and was giving himself more! So you can imagine this has raised a number of questions, like; “Who is your replacement and will your position be gapped?”
Roles and Responsibilities
The following are my main roles with basic detail and examples where applicable:
1. System Availability Programme Analysis.
2. Fire System Integration/Cause & Effect Commissioning.
3. Building Performance Testing Management.
4. Performance Testing & Client Witnessing Programme Planning.
5. BIM 360 Field Commissioning Strategy Management.
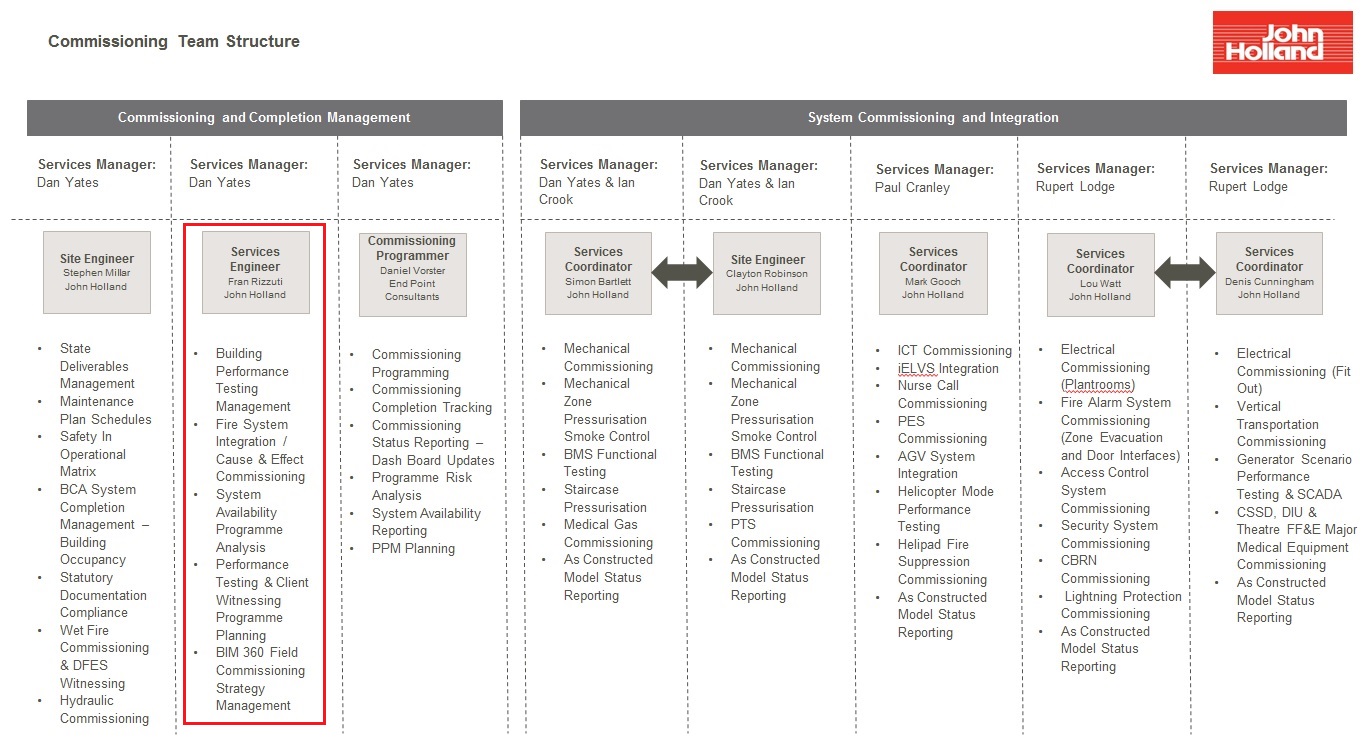
Figure 1. Commissioning Team Structure.
1. System Availability Programme Analysis
This consists of tying in the construction delivery programme with the commissioning programme. There are many factors affecting the ability for a system to remain ‘on-target’ for completion and therefore proves quite challenging to coordinate. A few examples are commissioning delays due to procurement issues; the lighting supplier experiencing manufacturing hold-ups and; late supply of the south side atrium façade affecting balancing of AHUs.
The latter example involved me searching through many detailed shop drawings and the Federated BIM Model to establish which air diffusers and grills are open to the atrium thus affecting the balancing of the AHU they are associated with. If the AHUs were balanced in their current state any building dust and debris would potentially contaminate the ductwork and would require cleaning all over again, not to mention give false air balance readings due to the large amount of air flow from the open space to the atrium. Figure 2 shows the current condition with the photo taken from the ground floor of the atrium with Levels 2 (Central Sterilising Services Department (CSSD)) & 3 (Operating Theatres) both open to the atrium. Both levels continue off to the left of the photo and present a significant opening.
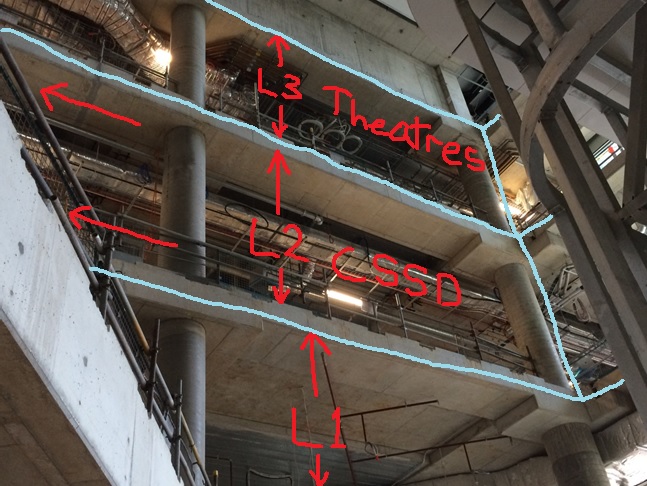
Figure 2. The Affected Open Levels to the Atrium.
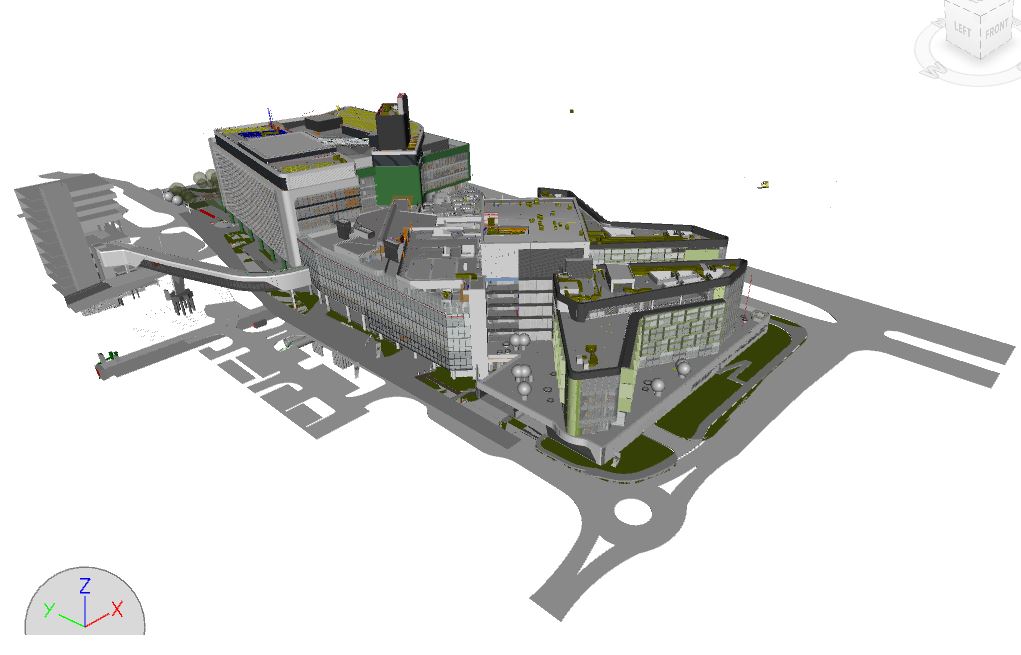
The atrium glass façade fitted by subcontractor, Annapurna, is to be 90 mm thick and fire rated to 2 hours. Figure 3 shows the BIM Architectural Model of how it will look once complete (same angle as the photo in Fig1). Figure 4 shows the two levels from on top of the Level 1 balcony.
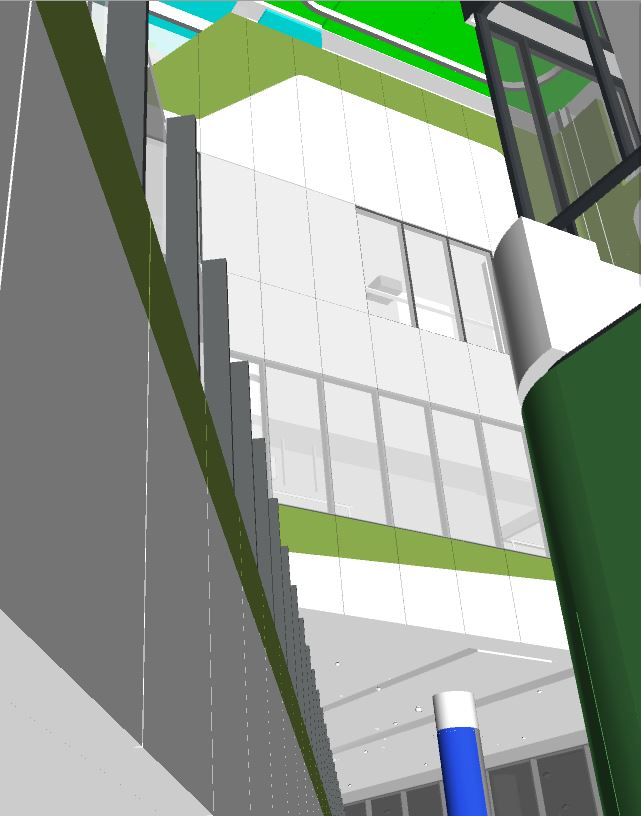
Figure 3. The Closed off Levels to the Atrium.
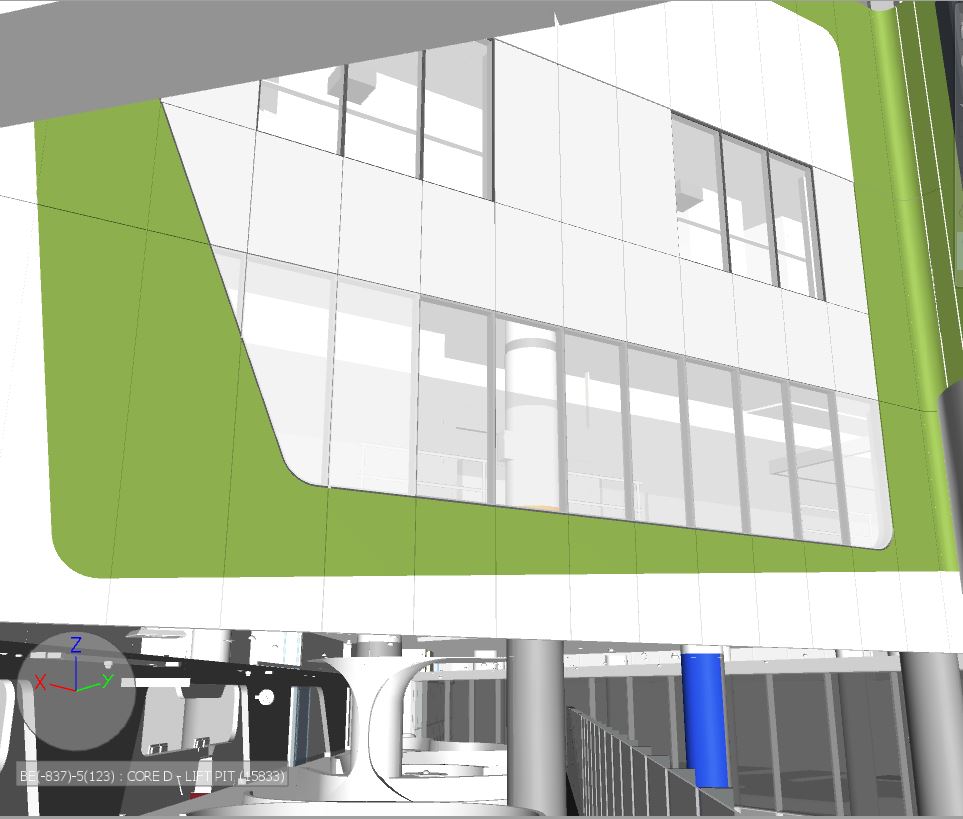
Figure 4. Atrium Facades in place viewing from Level 1 Balcony.
2. Fire System Integration/Cause & Effect Commissioning
This is a Cause & Effect Matrix based on a fire/smoke fault condition and explains what various systems should or shouldn’t do in a fire/smoke scenario. Fire and Smoke is just one of ten scenarios where the building is experiencing a fault condition. This particular Cause & Effect is quite complex especially when you consider that in normal operation mode certain rooms/areas are either negatively pressurised (infectious disease ward) or positively pressurised (operating theatres). Essentially the fire/smoke management system is stand-alone and hard-wired into various Variable Speed Drives (VSDs). These control specific AHU fans, fire and smoke dampers, wet and dry fire suppression systems and fire/escape door opening/closing systems. These are all monitored by the Building Management System (BMS).
3. Building Performance Testing Management
This is testing and assessing the performance of various systems and ensuring that they conform to Australian Standards, the design specification and ultimately meets the client’s technical specification.
4. Performance Testing & Client Witnessing Programme Planning
This is taking the above various performance tests and allowing the client to witness them. An example of which is the UPS room which will be covered in a separate blog.
5. BIM 360 Field Strategy Management
This consists of managing and coordinating the documentation and data entry of all commissionable systems into BIM 360 Field in order to meet the client’s requirement of Level of Detail (LOD) 500. This has meant creating a Commissioning Register in BIM 360 Field and a process that enables the commissioning team to track the progress of each system through its commissioning. Being a bespoke and innovative method of information management and integrating it with BIM Models has meant learning an entirely new way of doing business, one which has required deeper understanding of REVIT (CAD) Models and BIM in general so that I could conduct training workshops and aid the subcontractors in their understanding.
An additional task, which was confirmed in my latest CPD/DAP mtg by the Building Services Director, is for me to write up the BIM 360 Field Commissioning Implementation Plan for the PCH Project. Producing this document now may seem a little back to front considering we should have met Practical Completion in early July 15. However, BIM 360 Field was not procured until 2 yrs into the project and the original BIM Project Implementation Plan (by PDC) therefore had no mention of 360 Field. In addition, we are only now learning the challenges in its utility as a commissioning progress and information management tool. It will hopefully be similar to a lessons learnt document you might read from a previous operational tour; its intention to provide important information and help write a generic BIM 360 Field Commissioning implementation Plan. This will then aid JHG Corporate Staff in potentially combining it into a greater JHG Strategic BIM Implementation Plan. This gives me a great opportunity to re-inforce the recommendations that fell out of the conclusions I made in my TMR on BIM – What are the advantages of Building Information Modelling and how does its implementation allow John Holland Group to become the market leader?
In Other News
Han and I went to see Clarkson, May and Hammond Live at the Perth Arena. Excellent, with supercar porn (figure 5) and top banter aimed at the BBC for Clarkson’s Top Gear faux pas. The motorised lacrosse (figure 6), clearly car football but renamed for legal reasons to avoid Top Gear backlash, was hilarious even though the final score was Eng 4 – Aus 5.
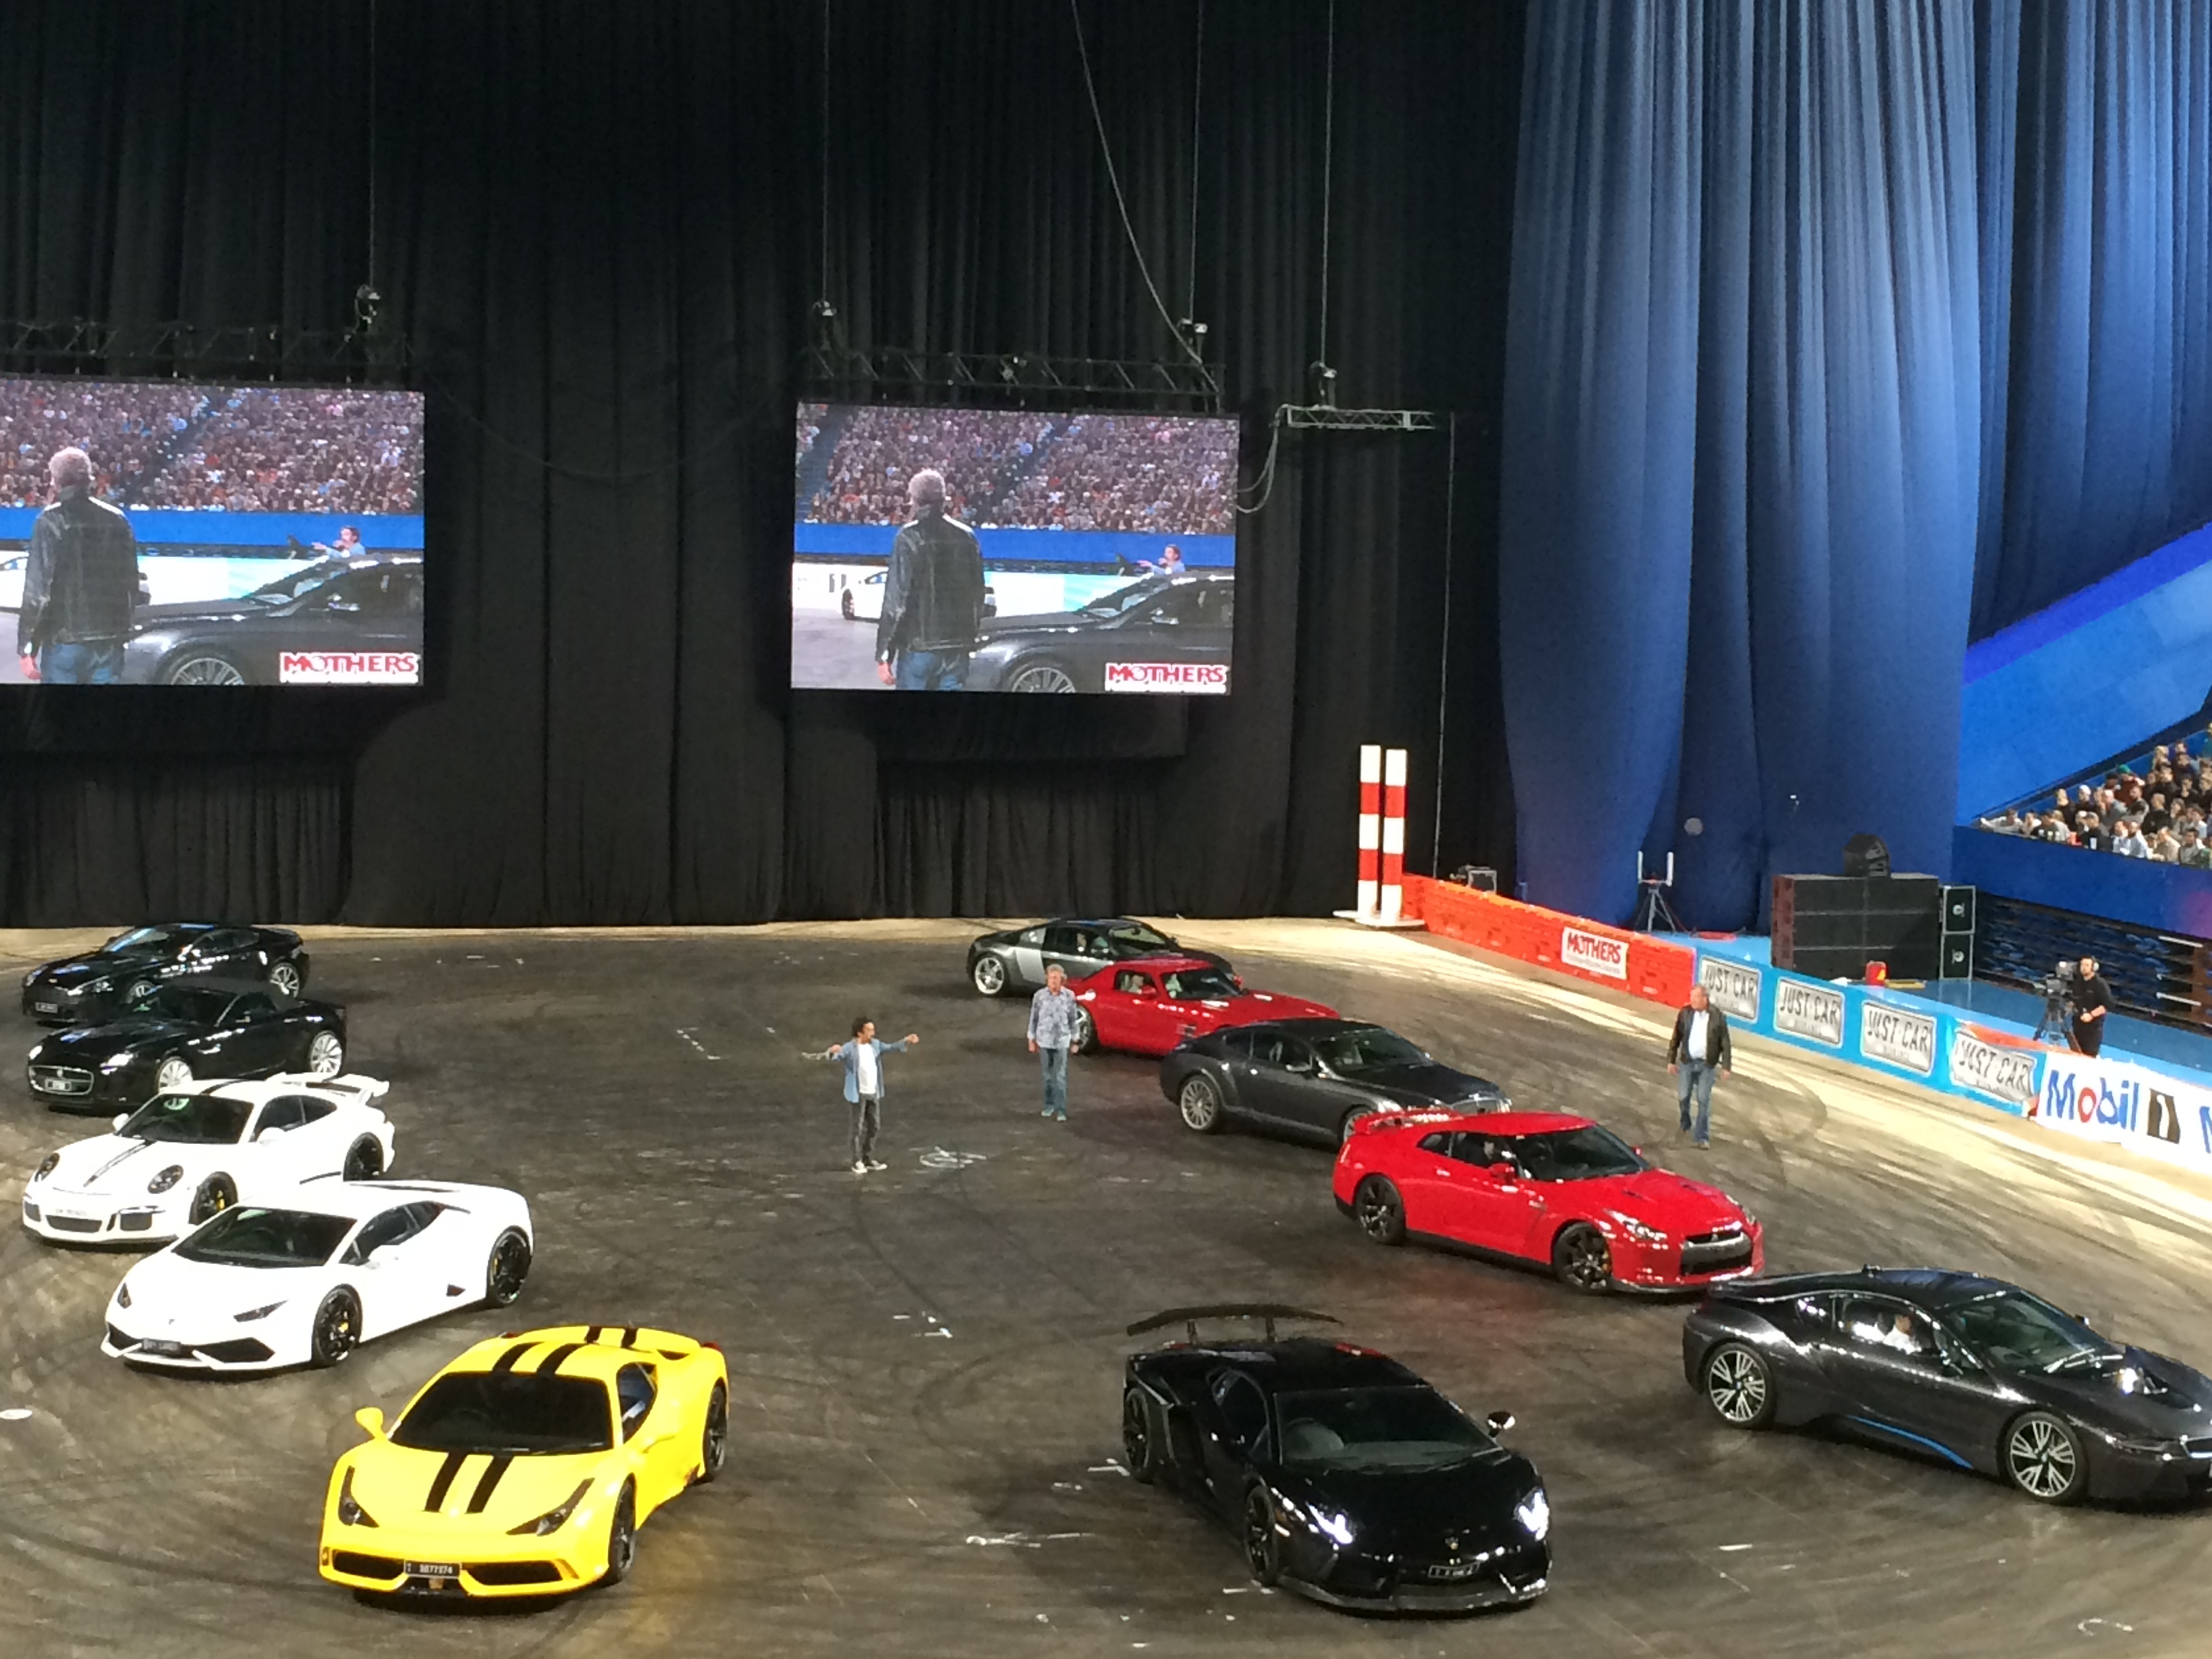
Figure 5. Supercar Porn.

Figure 6. Motorised Lacrosse.
Finally, and proving that even when you’re out on a social you’re always learning, I experienced an excellent example of an innovative carpark system. It is the underground carpark of the Perth Arena and as you can see from the photo in Figure 7 at the end of each row there are LED boards informing you of how many spaces are free in that row. Then when you turn in to that row you see a line of LEDs, red or green, with one next to each parking bay – the green ones being empty. Like Aleksandr the meerkat would say “makes finding a parking space simples”.
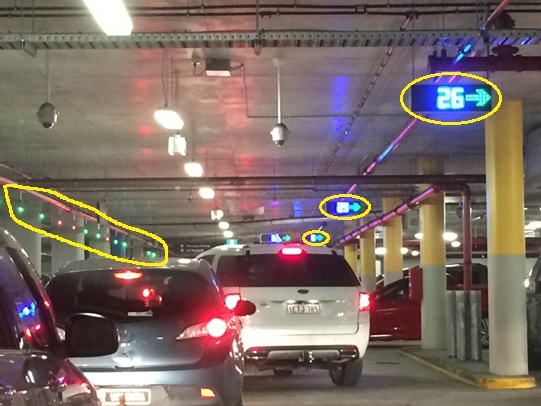
Figure 7. Perth Arena Advanced Underground Carpark System.
Oz PCH – The BIM 360 Field Application and its use in Commissioning.
The PCH Federated BIM Model
Introduction
Continuing on from Olly and Howard’s blogged experiences with BIM, I thought I’d add mine too. From the sounds of it I have been a little more involved in its use, or I should point out it’s one of my roles and responsibilities of the project. This has meant I have had to understand BIM in its wider sense/application (hence I decided on BIM as my TMR 1 topic) and therefore grapple with it on this project. Due to various complexities and getting a brand new process up and running I have waited till now before blogging about it.
Why BIM?
Throughout the lifecycle of a project BIM based models continuously develop with vast amounts of information requiring data entry. This increased development of information is used to measure goals and milestones and is referred to as Level of Detail (LOD). There are six LODs; 100, 200, 250, 300, 400 and 500.
The Client (State of WA) required the use of BIM and in line with their Technical Brief JHG are to provide LOD 500 (A Facilities Maintenance and Management Model (based at BIM maturity level 3) for all equipment within the Federated BIM Model. This will be achieved through the utilisation of Autodesk’s BIM 360 Field application (BIM 360 Field is the QA/QC application used in construction, on-site in the ‘field’). The implementation of BIM 360 Field on this project is cutting-edge and so to my knowledge has never before been attempted anywhere in the world to this level on such a scale and complexity. Apart from ceiling and wall closure sign-off, the use of BIM 360 Field for the commissioning of building services is being implemented in a novel way and stretching its capability into unchartered territory. Mapping equipment in the Federated Model to all test, commissioning, operational and servicing documentation is vital to meeting the LOD 500 requirement. This not only serves as an electronic repository of as-built information but also aids in the Facilities Maintenance (FM) Management of all building services systems throughout the 24-month Defects Liability Period (DLP) and remaining lifecycle of the facility.
The aim of utilising BIM 360 Field as the means to linking this information is due to its technological superiority over other information management systems and to enable the PCH facility to accommodate future flexibility. It also aims to allow JHG to build upon their BIM implementation experience for future corporate knowledge and growth. This is all in order to satisfy the building services commissioning plan and to ensure LOD 500 is met.
Analysis of JHG’s BIM Implementation Strategy
The requirement set out above was always known from the start of the project however the use of BIM 360 Field as the management tool was not…
From the outset the well-established use of BIM for model collaboration and clash detection was adopted (BIM level 2), as this was a client contractual requirement based on its scale and complexity. JHG acknowledged their lack of BIM experience and so in order to implement it effectively they identified the need to utilise a specialist BIM consultancy service. CSI Global Systems, with a contract worth AUD$1.5 million were to devise a strategy, implement and manage BIM for the project. This investment was in addition to licence fees and hardware.
JHG’s intention is to use the PCH project, being the first to adopt a BIM strategy, to help shape the way they see BIM adoption across all business sectors from a strategic level. From an operational/project point of view BIM implementation works very well with the various models collaborating together and using clash detection effectively. However, on a tactical/detailed level there have been some extremely challenging aspects as the following decision timeline over the expected four-year project explains:
- Dec 2011 – Project Start Date.
- Jan 2012 – QA/QC Manager requests for a defects management tool (BIM 360 Field researched and proposed).
- Dec 2013 – Decision to trial BIM 360 Field finally granted.
- Feb 2013 – Trial completed with the use of iPads.
- Apr 2013 – Implementation of BIM 360 Field on wall and ceiling closures (aided by additional hire of a BIM consultant).
- Jun 2013 – Web programme and application of BIM 360 Field designed with students’ help through designing Application Programme Interfaces (APIs) thus allowing uploads of data mapping to the federated model and 6D elements.
- Dec 2015 – Estimated Practical Completion.
BIM 360 Field used for raising issues and as a defects management tool (its intended use) works extremely well as does the ability to have this data displayed on a dashboard through the BIM 360 Field web application. Many challenges came as a result of the late procurement of the application and therefore were not planned for in the implementation strategy. These were; lack of understanding, training and competence in its use in delivering the additional requirements of meeting LOD 500 (6D FM) (at maturity level 3); and data mapping to the federated ‘as-built model’. These are still causing issues but the biggest challenges are software design glitches. The BIM 360 Field application has been developed by Autodesk for the construction industry specifically to aid in transforming the way in which data is collected, connected, visualised and managed. It extends the benefits of BIM to the construction, commissioning, completion and facility management processes. However, the reality of utilising BIM 360 Field is that Autodesk had never used some of its features on a project of this size and complexity before and as such it could be argued they are using the PCH project as a test-bed for future enhancements. This has created numerous issues that have in reality hindered the application’s perceived benefits.
Initial Implementation Issues
Overall the keys issues/limitations of adopting BIM 360 Field have been:
- Late implementation (by approx. 2yrs).
- Little to no resources allocated for its dedicated implementation.
- Extra requirements added; LOD 500 6D (FM) and links to federated model.
- Poor/little implementation strategy.
In conclusion JHG’s initial BIM implementation strategy was sound, utilising BIM consultants due to their lack of BIM knowledge but particularly due to the complex nature of the project. The implementation at level 2 was coordinated well and continues to provide tangible benefits however the BIM 360 Field application proves to be challenging in delivering LOD 500. Maybe adopting BIM 360 Field from the outset with increased resources, education and training or on a much smaller project first could have helped ensure better success than what is being experienced at present.
BIM Model Structure
BIM 360 Field Strategy Management – What have I done?
The Problem
We (the commissioning team) have been instructed to use BIM 360 Field for commissioning management and coordination across all commissionable systems throughout the project. This poses many challenges (as above), the key ones being:
Late Adoption. Due to late adoption, the BIM consultants (PDC) who wrote the BIM implementation plan for the entire project and who manage the Federated Model didn’t include the use of BM 360 Field. This means there is no strategy to follow and therefore from a technical point of view proves challenging to understand and ultimately costs time.
Lack of Understanding. How to utilise BIM 360 Field for commissioning related activities. This has meant experimentation and the process evolving as and when problems arose and were then subsequently resolved.
Lack of Support. From a technical perspective by Autodesk and from a commercial perspective by JHG in terms of manpower and financial resources.
Although BIM 360 Field has BIM in its title (how Autodesk packaged and sold it), it is nothing more than an information management tool. It allows the commissioning team and managers to view information and documentation flow according to the process. This is not part of commissioning per se but is the background administration necessary to enable interrogation of the commissioning register and find out what may be holding up the commissioning of services systems. This then aids us by creating efficiency in directing our focus on a particular area, important on such a large project with so many diverse systems, to solve a particular management or engineering issue.
Considered Options. With limited experience in the use of BIM 360 Field and what the application could offer, various options were difficult to conceive and so the commissioning team could only review the processes that were set-up for ceilings and wall closures. These processes relied upon the use of checklists updated via iPads in the ‘field’ by either the delivery team (building services coordinators) or trade contractors responsible for that area. There were many additional implications to consider when applying the same process to commissioning; primarily due to the requirement to commission by system rather than a specific area. Commissioning by system area delineation, rooms, zones and floors would have been a difficult undertaking especially as some systems are part installed by more than one subcontractor. The biggest challenge would be identification of issues as commissioning progresses so they can be efficiently resolved. This means having a robust information management system in place.
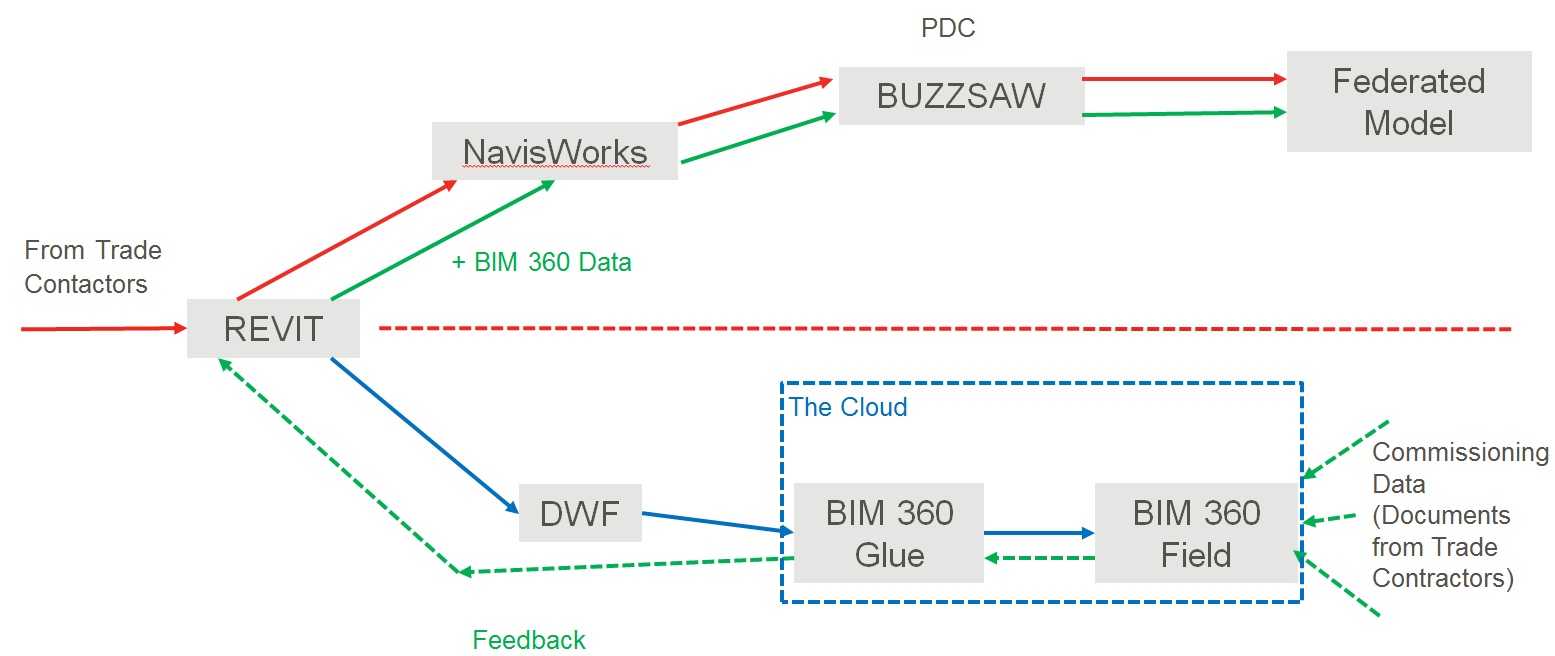
Chosen Solution. We decided to utilise bespoke checklists accessed through the iPad and created a Commissioning Register (spreadsheet) that acted as a commissioning progress (by system) display. The Commissioning Register is linked to the equipment in the BIM Federated Model through BIM 360 Glue (the software that links data from BIM 360 Field back to the ‘cloud’ and processes it back through to the original REVIT Model) and so when checklists are updated they subsequently update the Register thus displaying progress based on the traffic light system. More importantly, any issues that arise along the way are captured (through iPad use) and allow us to resolve them to closure. A key part of the solution was the communication of it and how we intended to implement it.
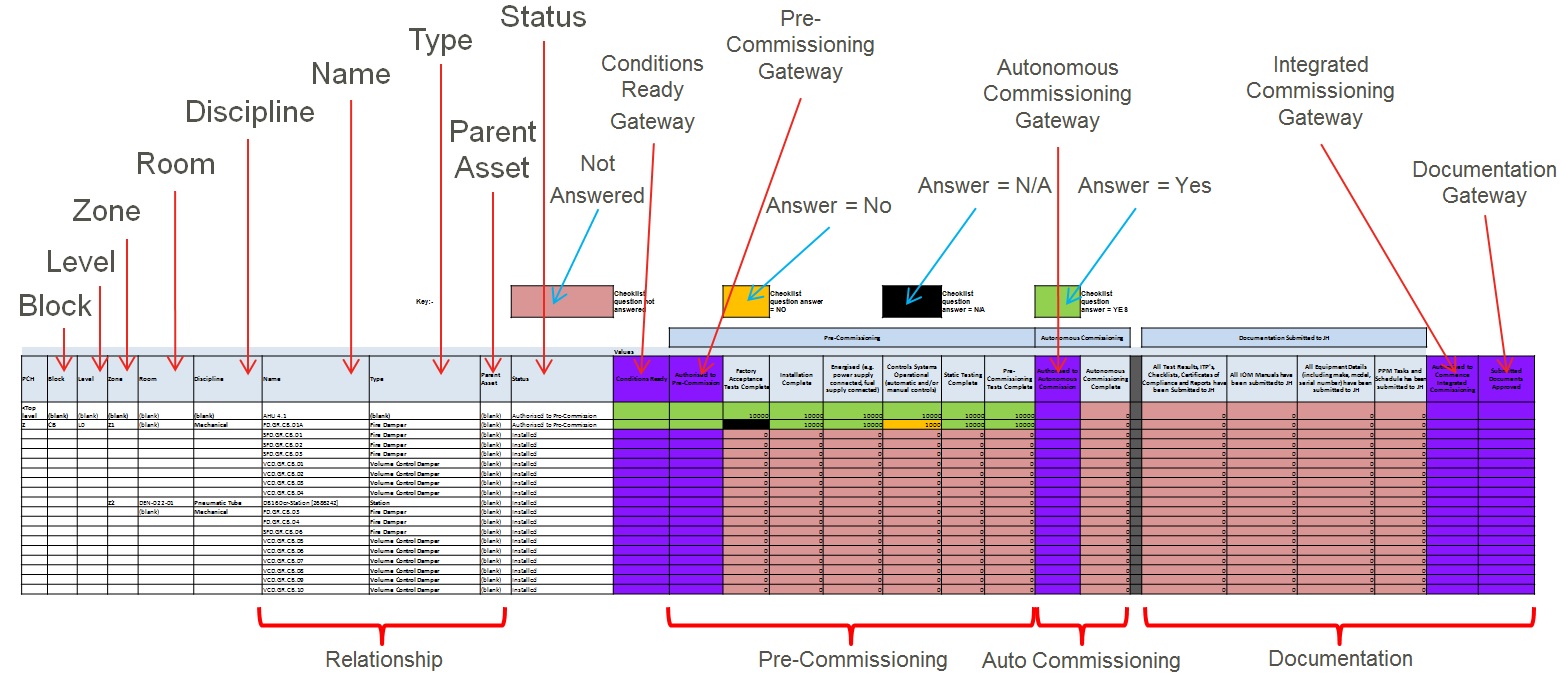
Commissioning Register – updated directly from BIM 360 Field inputs.
Justification. This was based on the need to find the easiest most efficient way of meeting the requirements as set by the Client and one that could be easily communicated to all involved and thus understood.
Implementation. We came up with a strategy to implementing our solution to the problem, the detailed process and what steps we took to get buy-in from both the JHG project delivery team and trade subcontractors. In summary it consisted of a greater understanding of BIM 360 Field and its capabilities, production of a commissioning management process, a Commissioning Register (for progress reporting) and a number of presentations communicating our coordination plan.
The Commissioning Process.
Associated Costs. The investment required was relatively small totalling in the region of AUD$330,000 for the Autodesk licence, consultant and data handling fees. What is more difficult to cost is the time spent in developing the process with multiple individuals and teams involved.
Food for thought
It would be interesting to hear other users views on BIM…
Upcoming ICE Event
The ICE are hosting the following conference at link below which seems very interesting. I wonder if anyone from the school, current Phase 1 students might be going.
ICE BIM 2015 – Realising the Promise Conference.
Oz PCH – Bad Press.
The following link is a report from the Australian Financial Review News Paper regarding JHG’s treatment of sub-contractors.
In summary, a sub-contractor (Yuanda) has issued a claim demanding payment of AUD$8.6 million as part of a progress payment with two other subbies following suit.
The payment is being withheld due to defective/damaged work and the report says that Yuanda’s claim states that JHG is not entitled to offset payment for defects under their subcontract.
Below is an extract from my AER 1 regarding payments:
…In terms of the sub-contracts JHG will, subject to any rights to set-off, pay the subcontractor through either Percentage Progress (% against pricing schedule) or Quantities (re-measurable basis) payment methods. Once a payment claim is made by the subcontractor JHG have to produce a payment schedule and, by the scheduled timeframe, make payment on account until approved security of the amount has been acquired and the final payment can be made. JHG can deduct from payment monies otherwise due to the subcontractor under the rights of set-off (JHG (B) 2014).
The right of set-off from the standard subcontract itself states:
12.18 Right of Set-Off
John Holland may deduct from moneys otherwise due to the Subcontractor under or associated with the Subcontract:
(a) any debt or other moneys due from the Subcontractor to John Holland; or
(b) any claim to money which John Holland may have against the Subcontractor whether for damages (including liquidated damages) or otherwise.
Technically Yuanda are right. The off-set explained above at (b) is JHG’s right to off-set payment in the case if JHG get hit with liquidated damages from the Client for late delivery caused by defective/damaged works by the sub-contractor.
JHG automatically hold a percentage back, usually 5% for a one year Defects Liability Period (DLP) but this project has a two year DLP so it may be slightly higher. Either way it is this sum that JHG are contractually obliged to withhold payment on should the work be defective and not the reported progress payment.
I haven’t actually seen the specific Yuanda sub-contract so there may have been another clause put in but either way it’s not good press.
So what?
This kind of bad press could cause many things to happen, the most significant of which would be that JHG lose potential tenders. Additionally, for tenders that JHG have won, when it comes to tendering for sub-contractors these sub-contractors may either look elsewhere or see an opportunity and to protect themselves from potentially getting shafted, factor in a higher contingency risk fee. This results in JHG either being left with a substandard sub-contractor as a result of not assigning a ‘preferred sub-contractor’, which they may have spent time and money on sweetening-up from a previous project, or worse still getting the ‘preferred sub-contractor’ on-board but paying out more for the privilege.
Oz PCH – Pipe sizing issues leading to serious commercial implications…
Back in Oct 14 correspondence from NDY (Design Consultants) to Fredon (Mech Installation Subcontractor) raised an issue and posed an RFI regarding both Hot & Chilled water schematics. The RFI asked confirmation that all pipework had been sized and the network designed in accordance with a maximum velocity of 2.5 m/s and maximum pressure loss of 400 Pa/m. Fredon’s reply was yes it had.
In Jan 15 a meeting was held between JHG, NDY and Fredon which highlighted some issues with pipe sizing as referred to above.
In Feb 15, JHG with Cundall (commissioning consultants) conducted a review of all pipework sizing across the project. They found a number of incorrectly sized pipe sections which, although were within the acceptable velocity limits resulted in pressure losses exceeding the maximum 400 Pa/m. These were marked up and sent to Fredon to address asking that they carry out a review to ensure the issues were resolved as soon as possible. In addition it was determined there were also a number of commissioning stations missing (also marked up on dwgs) thus potentially jeopardising the ability to correctly commission the system in accordance with the CIBSE recommendations.
Fredon’s response was they had to change a number of pipe routes due to AHUs and Fan Coil Units moving location in order to make the plantrooms work and all other installed pipework was as per the design schematics from NDY; which didn’t state the 2.5 m/s or 400 Pa/m maximums.
It transpired that NDY did in fact omit the maximum values from their designs, however contractually Fredon don’t have a leg to stand on as all written sub-contracts state that subcontractors are offered the opportunity to review the Client’s Technical Brief and all works carried out must comply with that brief irrespective of any design requirements from the design consultancy (NDY). This case being a perfect example of why subcontractors are offered this opportunity so they can follow the Client’s intent. So, did Fredon view the brief? Of course not! Well not until the preverbal hit the fan.
The exact requirement from the Client’s Technical Brief states:
…pipework shall be designed with a maximum water velocity of 2.5 m/s and maximum friction loss of 400 Pa/m.
Why are 2.5m/s and 400 Pa/m the maximums? Higher velocities create more noise through vibration and higher pressure losses create inefficiencies in running the system and results in increased running costs.
This issue was presented to me on 19 May 15 by my LM to double check that pipe sizing runs in a couple of plantrooms were installed in accordance with the requirements above. There was a fair amount of digging into records etc to get a good understanding of the problem and also waiting for reviews from both NDY and Fredon before the whole picture became clear, hence the date of this blog.
Method
I was given two plantroom schematics; PR 6 (Heating Hot Water) and PR 5 (Chilled Water). Both had the pipe runs annotated with the pipe diameter (mm), flow rate (l/s) and velocity (m/s). Establishing if the velocity was in limits was easy as it was annotated on the dwg but I had to calculate the pressure drop (Pa/m).
To do this I turned straight to CIBSE Guide C Reference Data. I was given a steer that there was a CIBSE version available called the CIBSE Student Guide. This is basically a condensed version of all the most popular and more widely used parts of all CIBSE Guides rolled into one. So I looked here first and found the section with tables on flow of fluids in pipes and ducts. Looking at the Hot Water system first meant selecting the correct temperature (75ºC) and pipe material (copper).
I then simply read off Table C4.13 the closest diameter pipe size to what the drawing said e.g. Ø 65 mm on the dwg would be 67 mm from the table.
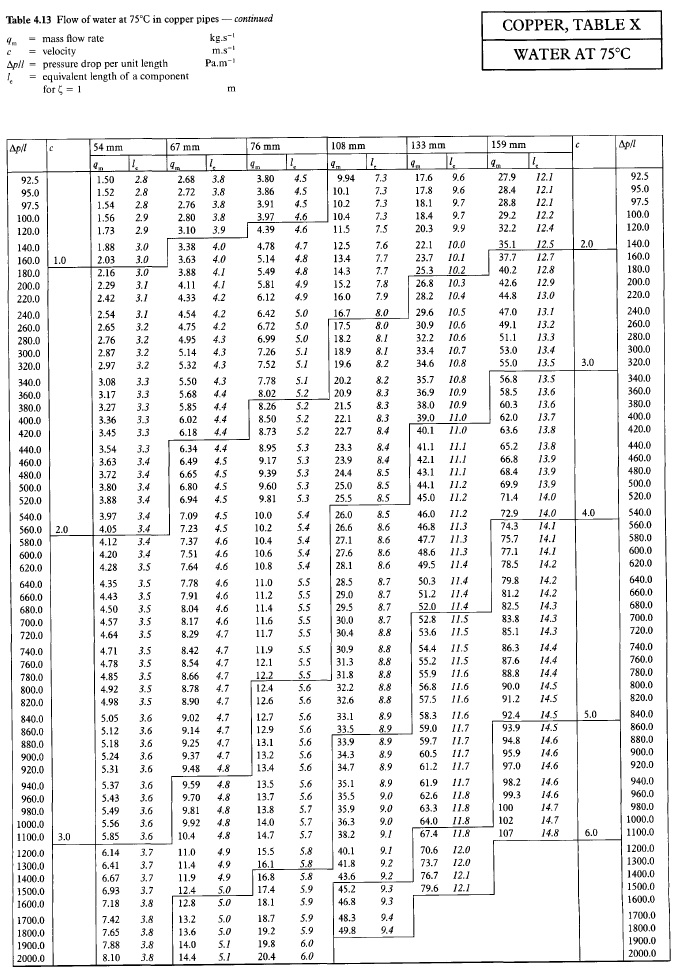
Table C4.13 CIBSE Guide C Reference Data.
Agreed there is a 2mm difference and yes I could simply interpolate between 54 mm and 67 mm from the table but for a quick and dirty answer this wasn’t necessary. Equally if I were to interpolate then I may as well get an even more accurate answer by using the mathematical method. Therefore using the various equations required from the main CIBSE Guide C doc, the mathematical solution is thus:
So it turns out word press won’t allow pasting of equations from word – rubbish!
The D’Arcy equation for pressure loss due to friction:
The friction factor, λ (for turbulent flow) was obtained mathematically from the Colbrook-White equation which is more accurate than using the Moody chart:
Reynolds number:
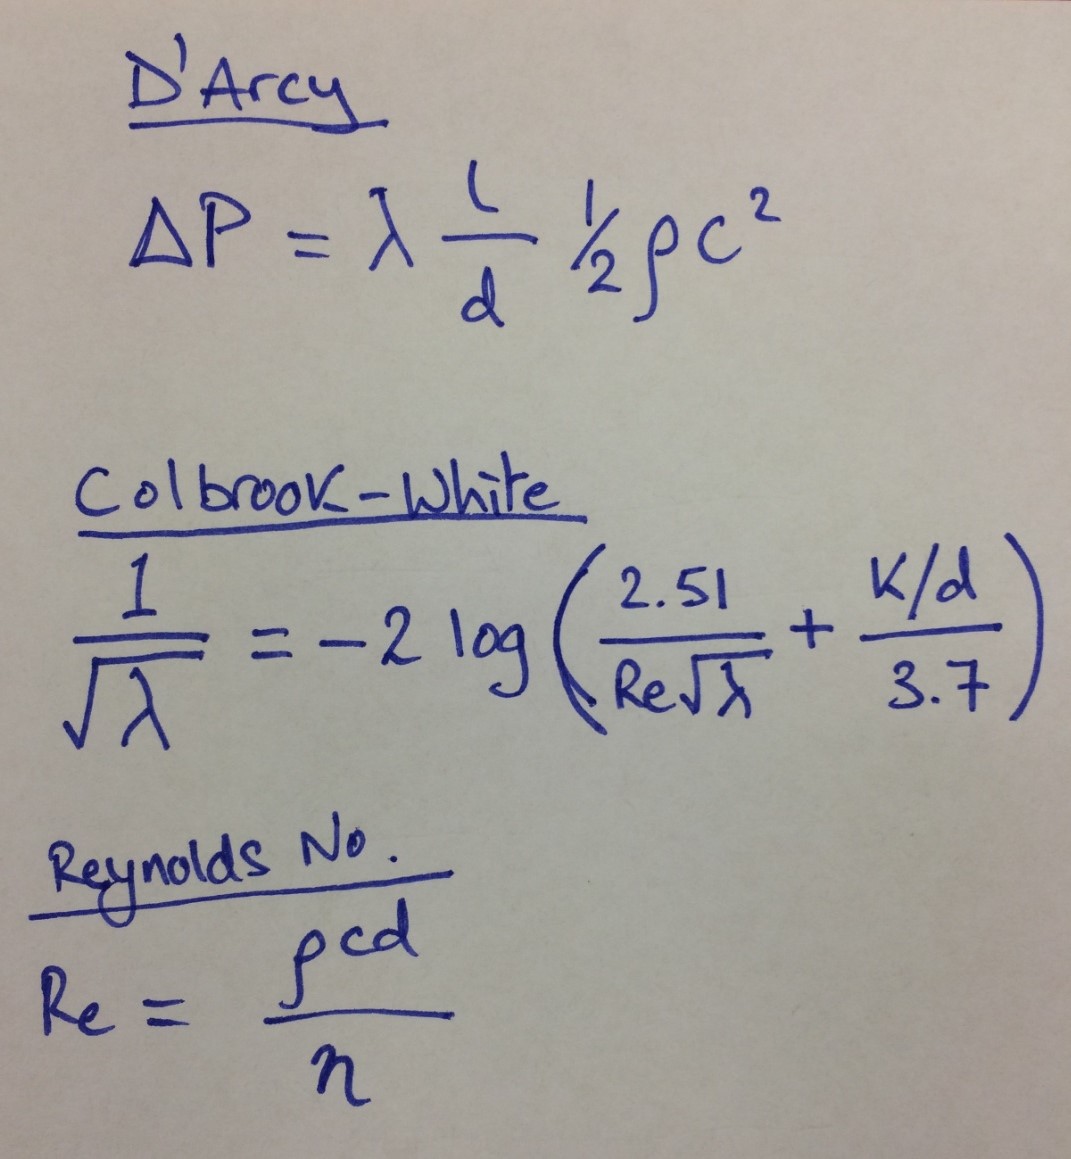
Equations for above.
Relative roughness = k/d
To determine the values of ρ (kg/m3), η (10-6 kg/m/s), and v (10-6 m2/s) properties of water I used Table 4.A1.1 from CIBSE but wanted the temp at 75ºC. So therefore some interpolation was required:
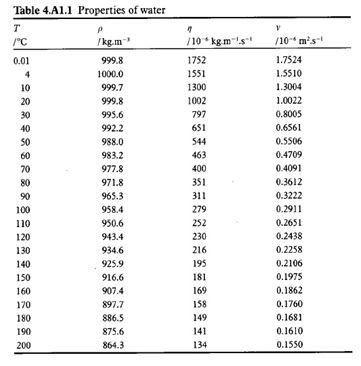
Table 4.A1.1 from CIBSE.
Using a handy interpolation equation:
d = d1 + (d2 – d1) (g – g1) / (g2 – g1)
Calculations
See below hand calculation sheet.
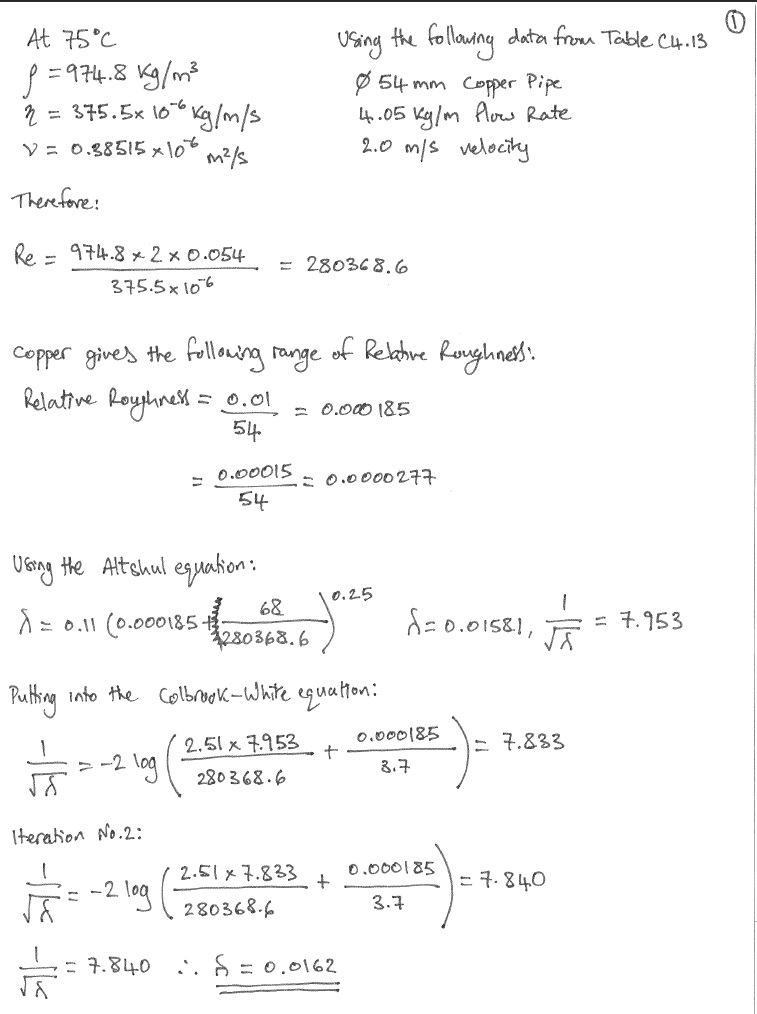
Hand Calculations – Sheet 1 of 3.
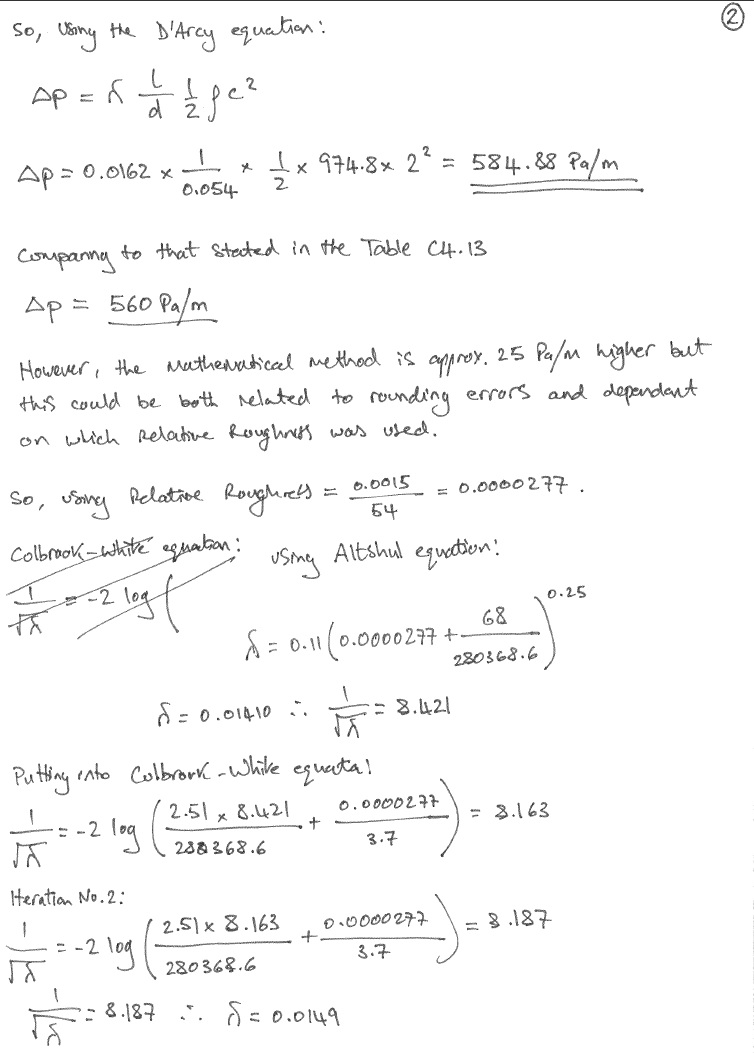
Hand Calculations – Sheet 2 of 3.
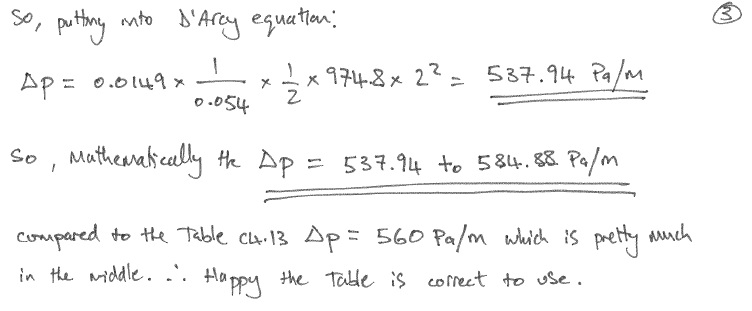
Hand Calculations – Sheet 3 of 3.
Therefore, if the schematic shows; Copper Ø 65 mm, at a flow rate of 6.63 l/s and velocity of 2.3 m/s the AIRAH charts gives a ∆P = 575 Pa/m.
Mathematically using the same process as above ∆P = 555 to 872 Pa/m.
The closest on CIBSE Table C4.13 is Copper Ø 67 mm, at a flow rate of 6.65 l/s and velocity between 2 – 3 m/s which gives a ∆P = 480 Pa/m.
Mathematically using the same process as above ∆P = 535 Pa/m.
Findings
As a result of checking other PR pipe networks it was found that a number of pipe sections were over the max 400 Pa/m. Therefore JHG issued a Non Compliance Report (NCR) (the highest quality control level of report that gets recorded against the project) stating that we conducted a review of Fredon’s pipework and found as stated above. Both Fredon and NDY went away and also conducted a review resulting in another mtg to discuss the findings along with the contractual implications.
In the meantime I wanted to double check the material for the pipework in PR5 as the pipe equipment in BIM said it was steel yet all other plantrooms used copper. On inspection there was good and bad news; the bad news was I couldn’t find the pipework (only the main 250mm dia supply coming up the riser) but the good news (related to the bad) was it hadn’t been installed yet hence no pipework found. This meant that any pipe sections diameters could be changed thus avoiding an expensive rip-out and re-install.
Steel is cheaper to purchase and more wear resistant than copper however, copper is easier to install (brazing method vs welding of steel) and thus saves time and therefore cost (making copper cheaper overall).
The outcome of this mtg was both NDY and Fredon used pipe sizing charts from the Australian Institute of Refrigeration, Air-conditioning and Heating (AIRAH) Technical Handbook to select their pipes but we couldn’t figure out whey on the same schematic (same velocity and pipe size) they were getting different pressure losses.
We asked Fredon to send us their AIRAH charts and after further investigation we found the error.
NDY say they designed all pipework using steel however their design brief for piping material talks about various materials but doesn’t actually state a design material. Also, there is no mention of material type on any of their schematics. The design brief states:
Pipe sizing on the drawings for pipe fluid velocity, friction rate and pump head calculation are the standard method of size identification for that material e.g. mild steel pipe – DN (nominal bore); copper pipe OD.
Where alternative pipe materials are scheduled as acceptable, the nominal bore of the alternative shall be equal to or greater than that of the nominated mild steel pipe DN.
Fredon made the value engineering decision to install copper and therefore should have understood that when comparing steel and copper the industry norm is to refer to them using their ‘nominal size’. As quoted from the Australian Standard (AS 1074 – 1989)
‘1.3.5 Nominal size (DN) — a numerical designation of size which is common to all components in a piping system other than components designated by outside diameters or by thread size. It is a convenient round number for reference purposes and is only loosely related to manufacturing dimensions’.
However, they should have also realised that steel’s actual internal dia is larger than the stated nominal size compared to copper’s actual internal dia which is smaller than the stated nominal size (copper’s nominal dia is almost akin to the OD (external dia)). This can be seen from the internal pipe sizing table at Table 4.2 CIBSE Guide C and the AIRAH charts below. This comparison is the same for both the UK and Australian construction industries, however, AIRAH present their charts with both materials having the same nominal internal dia and this is what caused the confusion resulting in the errors. NDY designed the pipe networks using steel pipe (e.g. 32mm dia gives 400 Pa/m) but when Fredon changed material to copper they simply used the same 32mm dia pipe. But a copper 32mm nominal pipe has an actual internal dia of 29.26mm which is smaller than the steel pipe’s nominal dia of 32mm (actual internal dia of 36mm) hence over a 6mm dia difference which creates higher pressure losses.
What Fredon should have done was compare the two AIRAH charts by material and therefore upsized the nominal dia of copper pipe to 40mm giving an internal dia of 35.61mm therefore meeting the design brief and thus ensuring a similar pressure loss to that of steel – not exceeding 400 Pa/m.
The charts below show the pressure loss of 82ºC water in both medium steel and copper pipe and compare three different pipe sizes to show the effect the material has on pressure loss.
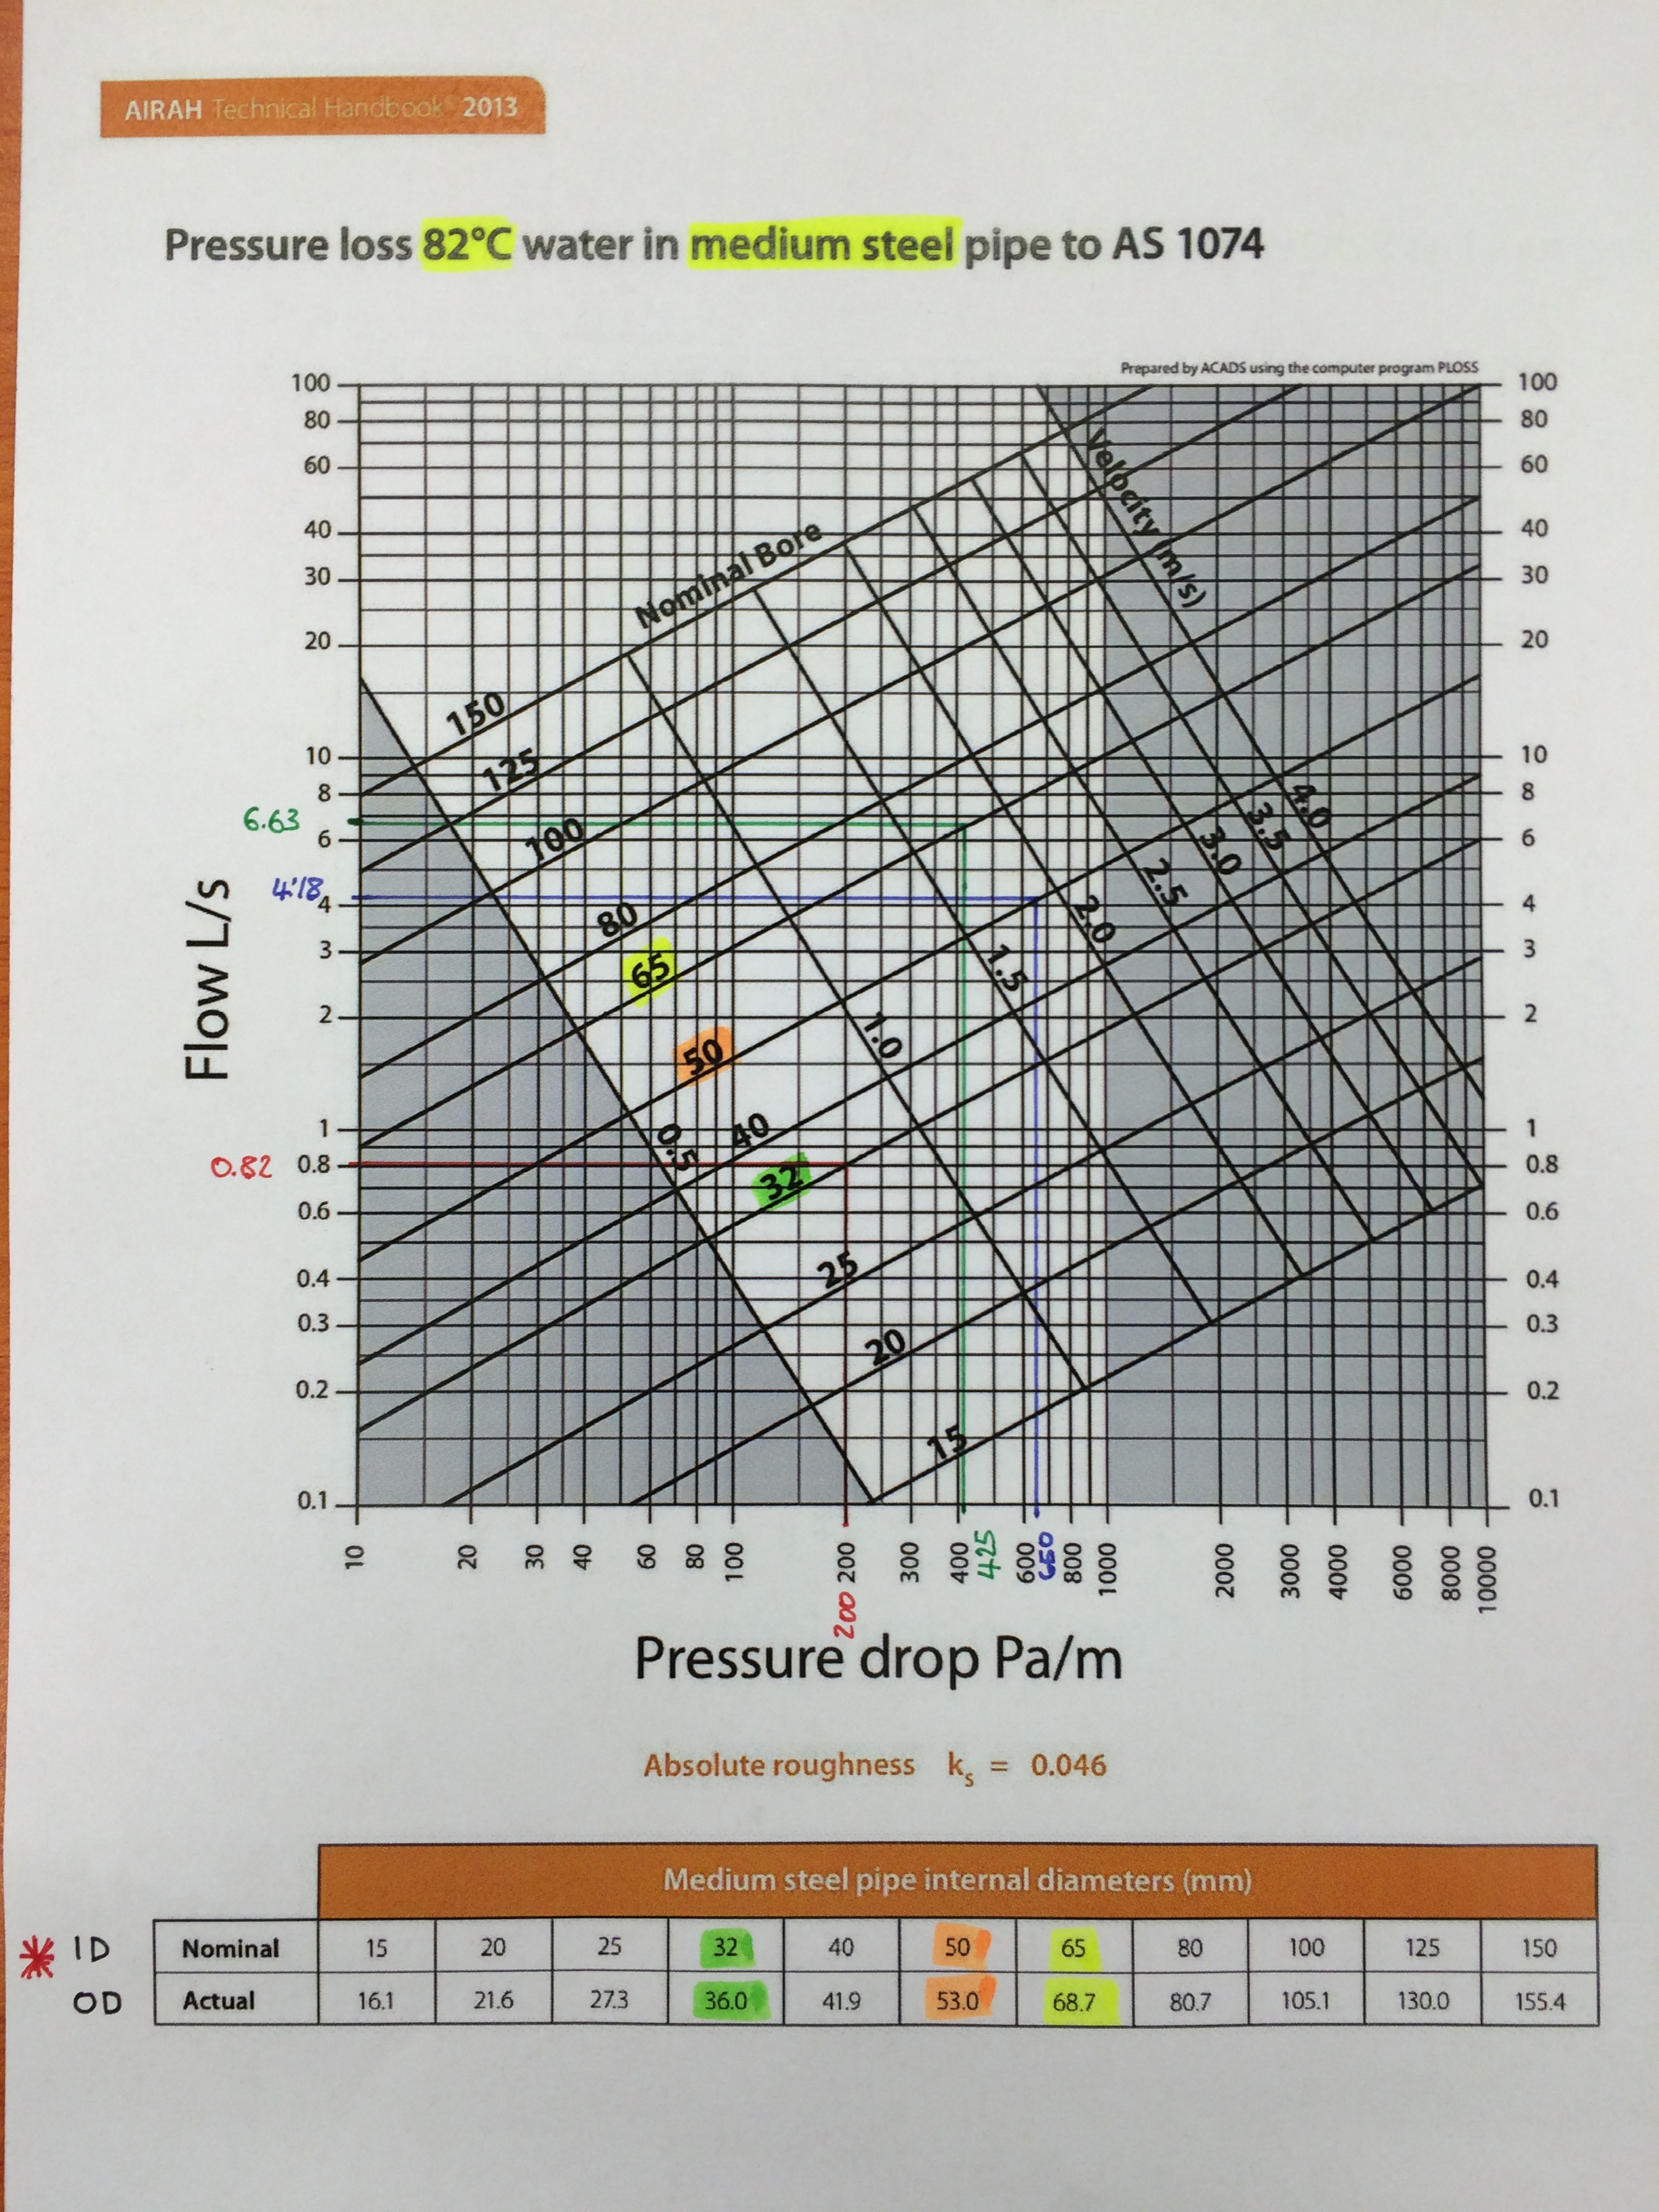
AIRAH Medium Steel Pipe.
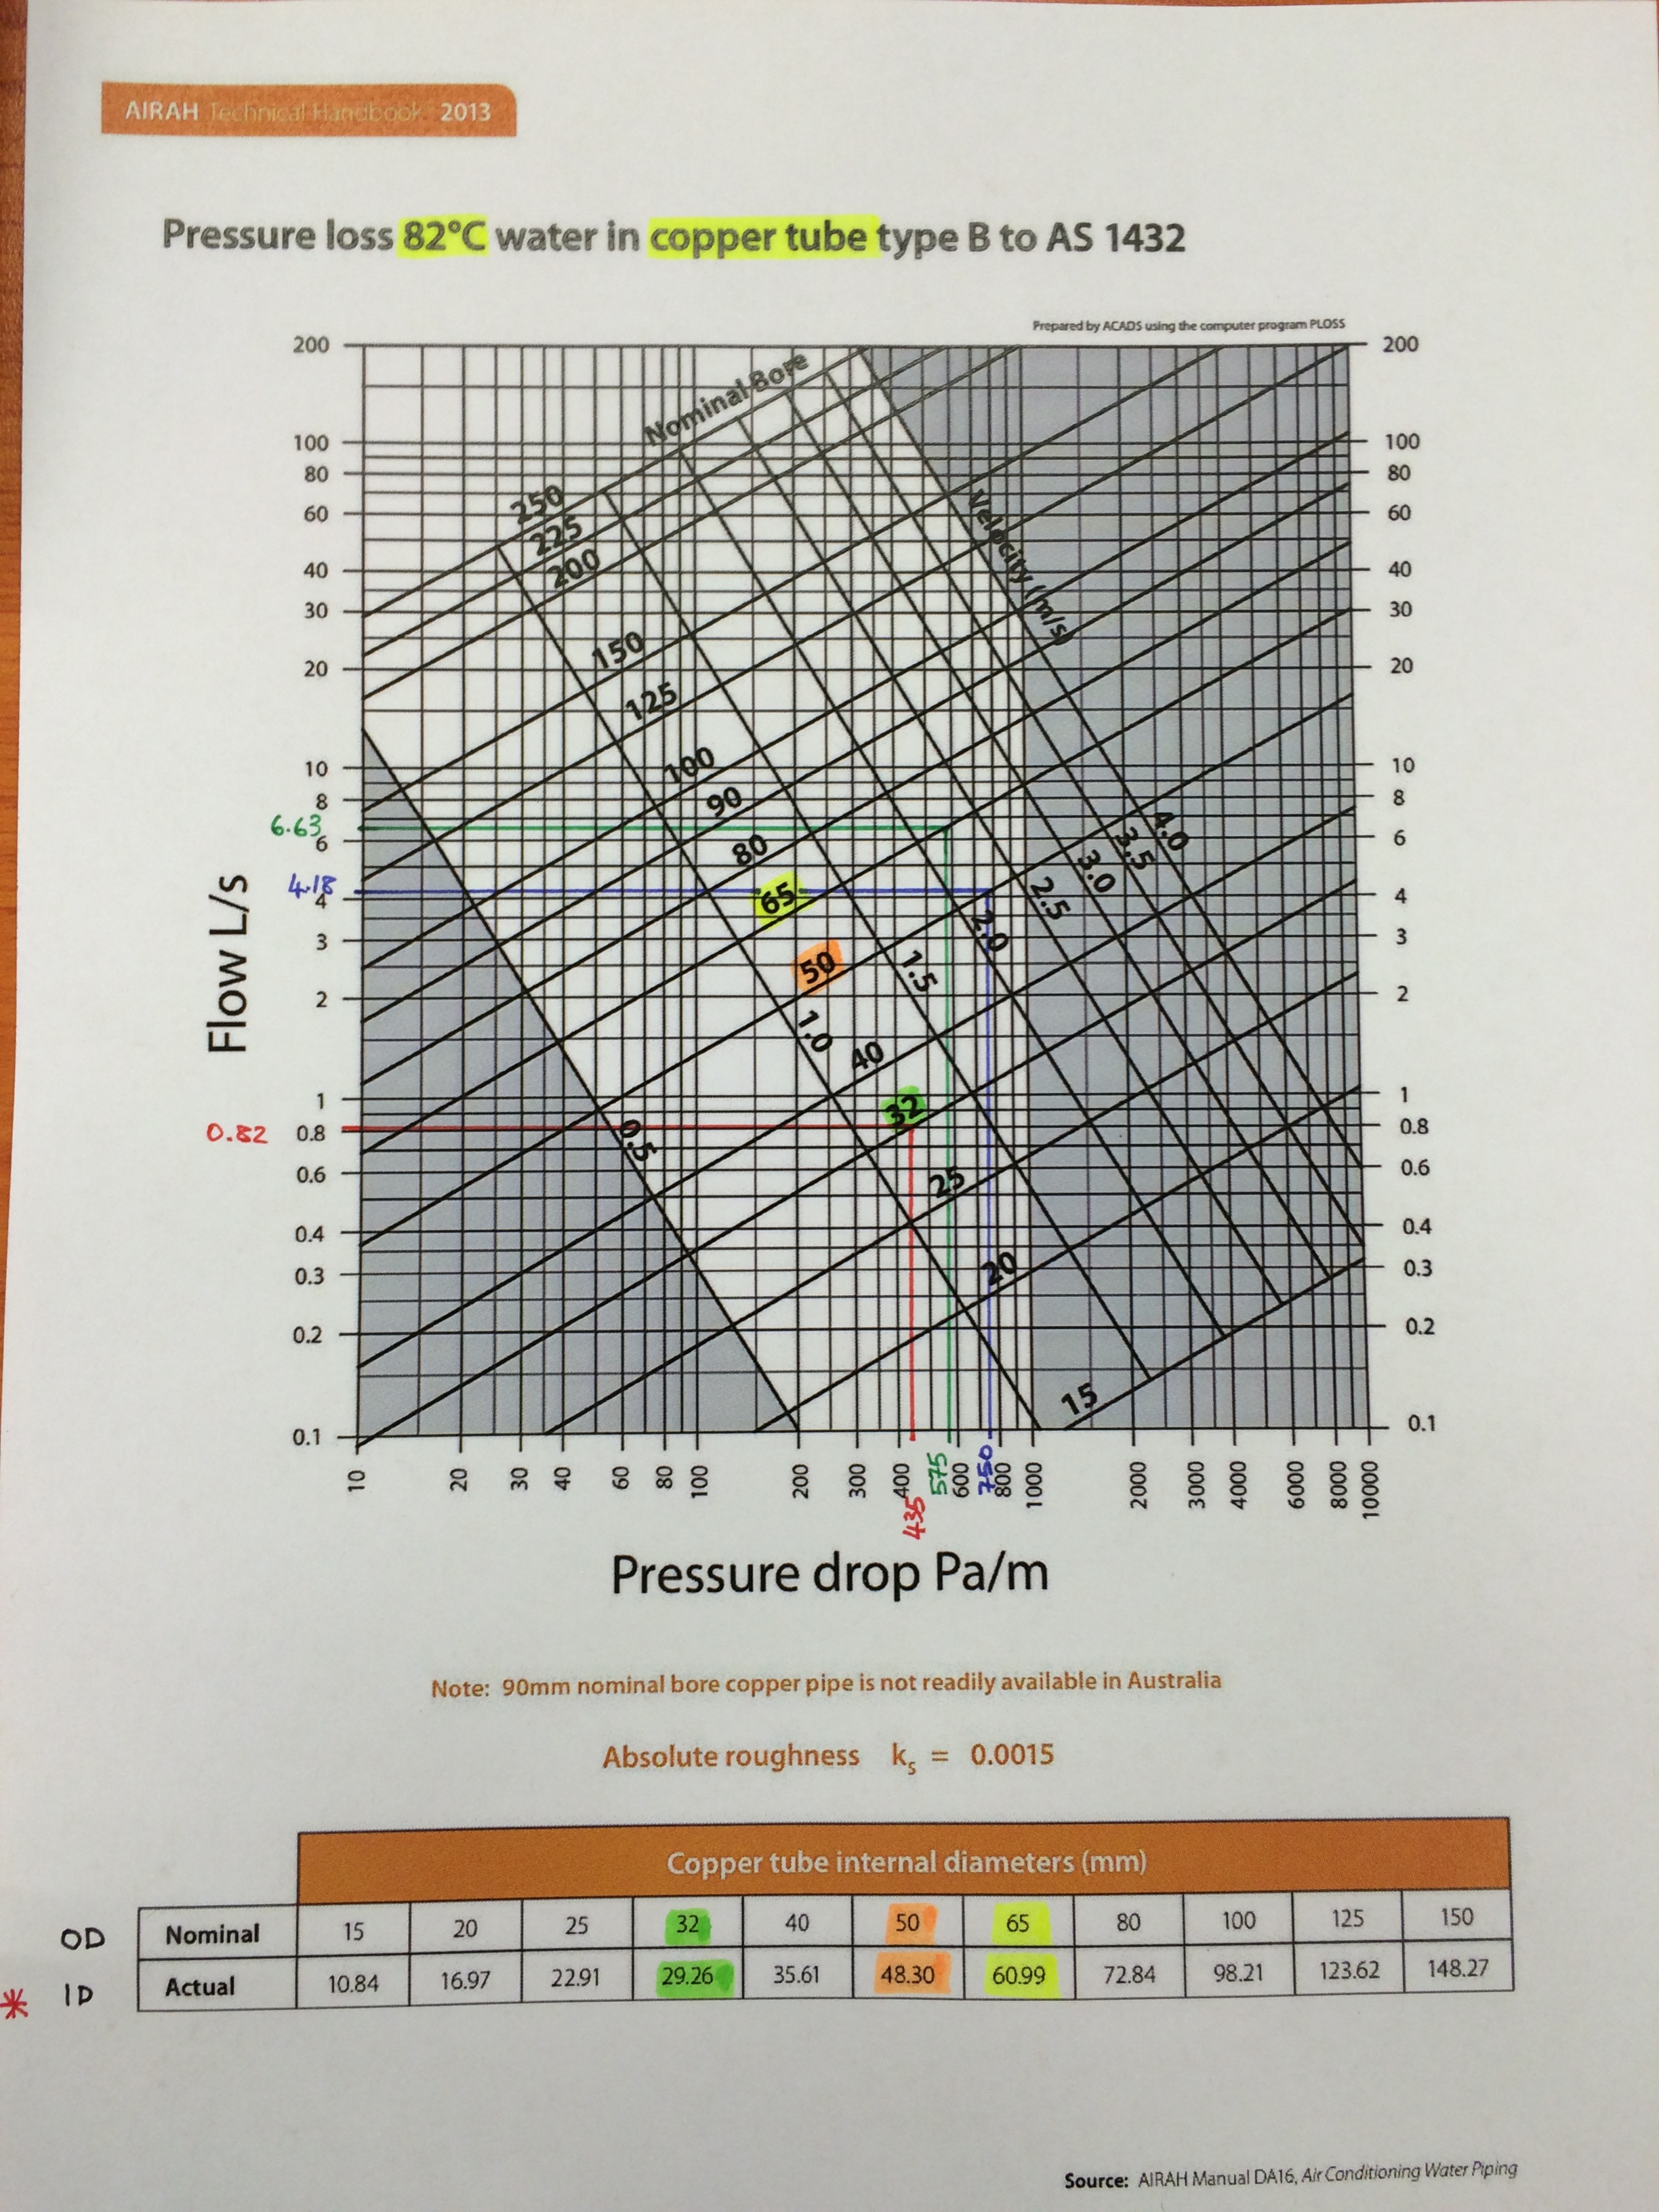
AIRAH Copper Pipe.
So you can see, assuming that you can change from steel to copper pipe (without identifying the nomenclature change AIRAH uses) is incorrect and results in under sizing your pipes thus increasing pressure losses.
This is why the CIBSE Guides and the UK construction industry, on the whole, use different standard pipe sizes for different materials to avoid this confusion. The table below is an extract from the CIBSE Guide C.

Table 4.2 CIBSE Guide C.
So What?
Technically, why does AIRAH refer to both steel and copper piping on their charts using the same nominal dia knowing the actual internal dia is very different?
Why don’t they use a different nominal dimension for say copper like they do in the UK and then have charts that reflect this like Table C4.13 from CIBSE Guide C?
The only dia that actually affects the flow rate and thus pressure losses is the internal dia (the A in Q = A x V), the nominal/OD and wall thickness matter not.
Commercially, JHG need to establish between NDY and Fredon who is the cause of the issue that means JHG currently don’t meet the Client’s brief. They need to establish the extent of what is required to resolve the issue and commercially who will pay for it. When taking into consideration the increased running costs over the lifecycle of the system with pressure losses above 400 Pa/m vs the project resolution (measured by cost and delay to project completion) of ripping out and re-installing new pipework, it could be argued that the latter would be much more expensive. Additionally, Fredon say the pipe runs that are above 400 Pa/m (in most instances around 550 Pa/m) are relatively short and thus the extra cost associated to the inefficiency would be negligible. In which case Fredon would rather pay the yearly additional cost for the lifecycle of the system rather than rip out and start again. Clearly not the point and goes against the Client’s brief and more importantly trying to achieve a system with the best possible energy efficiency thus helping to reduce carbon emissions.
Resolution Options
More importantly, to reduce delays, the resolution is the primary focus. There are two viable proposal options for the Project Director and the Client to discuss: both require proving the extent of the problem and then either; order Fredon to replace all incorrect pipework in PR’s 1 and 2 only (index run) and then request dispensation for the remaining incorrect pipework (doubtful); or order Fredon to replace all incorrect pipework throughout the building. Both have commercial and time implications but the second option could potentially bankrupt Fredon. Therefore, a key factor both JHG and the Client need to seriously consider in order to avoid unnecessary delays are the potential second and third order effects of having to get a different mechanical subcontractor to complete the works (with respect to meeting the project’s practical completion deadline). Either way JHG will still carry the problem to solve on the Client’s behalf.
Conclusions
The above findings don’t resolve the issue but will aid in leading to the correct commercial outcome. Fredon say they were following the NDY design schematics in which case 32mm pipe is correct but only if the schematic doesn’t state steel pipe. If the schematics do then Fredon, deciding to use copper, should have up-sized to 40mm as described above. So, JHG need to establish the material stated on NDY’s schematics in order to identify the faulty party. The truth is that neither NDY nor Fredon are squeaky clean and so commercially they may both end up paying for the resolution.
To resolve the issue JHG are looking primarily at replacing only the incorrect pipework on the index run (PRs 1 and 2). Through Fredon’s as-built drawings they should be able to establish which pipe runs are over 400 Pa/m and by how much and then estimate the extent of time and cost to replace them. Both of which JHG and the Client have a vested interest in keeping to a minimum.
The meeting this coming Monday will be very interesting and I will blog a subsequent update on the resolution and commercial aspects as they come to light.
Recommendations
It could be recommended that AIRAH change their pipe sizing charts to reflect those of the UK construction industry like those produced by CIBSE.
In other news
My collection of sports equipment is steadily growing so I have found a new hobby to help pay for it!
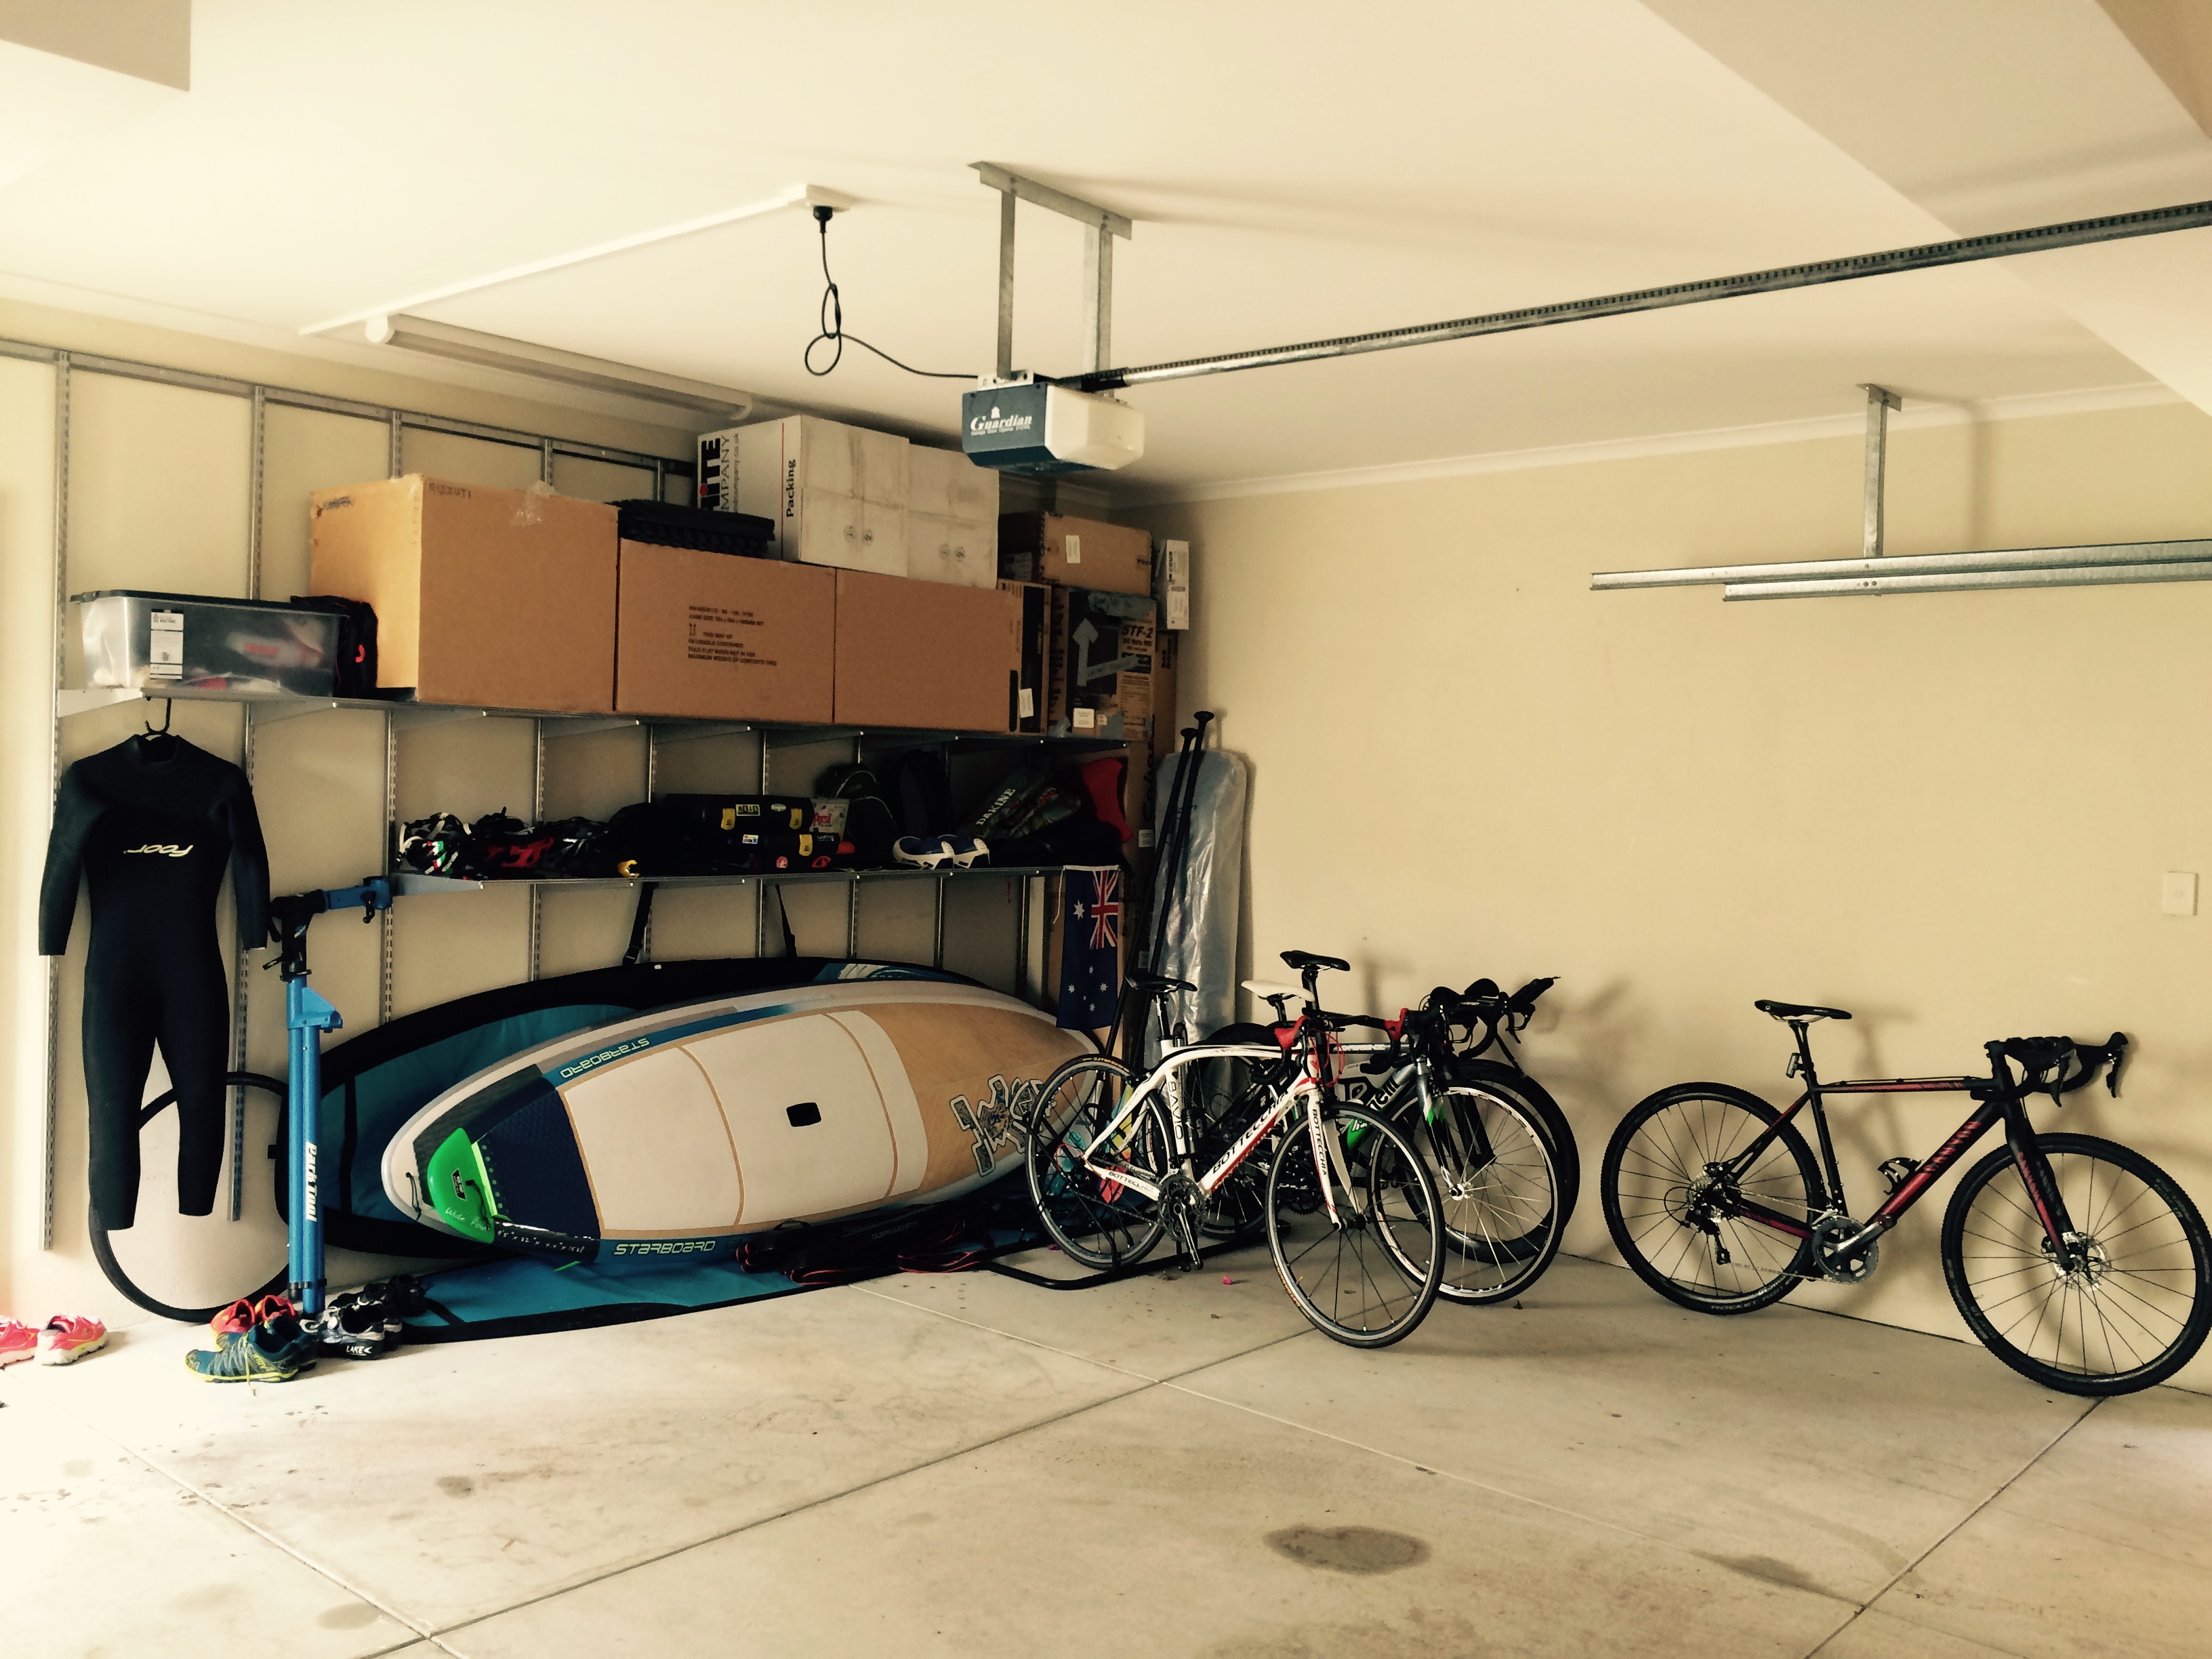
There’s snorkelling gear and a kite surfing training kite on the shelf too!

That’s my winnings!
Oz PCH – Knock-on Effect Issues
Diagnostic Imaging Unit (DIU)
I’m going to discuss an issue (small relative to the majority seen) but one that highlights a good example of the knock-on effects of last-min (late) design change.
The DIU houses the imaging equipment found in most modern hospitals the biggest pieces being the Magnetic Resonance Imaging (MRI) scanner. Here there is one to be installed with a further two areas completely fitted out (inc all control equipment etc) to be installed for future use. One of these future pieces is to be a Position Emission Tomography (PET) MRI scanner. PET is used when searching for cancerous tumours predominantly in the head, brain, neck and prostate and gives clinicians vital info like metabolism or physiology of the tumour. So, when coupled with MRI (used for soft tissue imaging like a CT scan would but with the added benefit of not exposing the patient to ionising radiation – important in paediatric oncology) it allows a key advantage over pure PET alone as PET is not capable of accurately assessing the local extent of the primary tissue in certain locations of the body like the head and neck, whereas MRI can (HealthPACT, 2012).
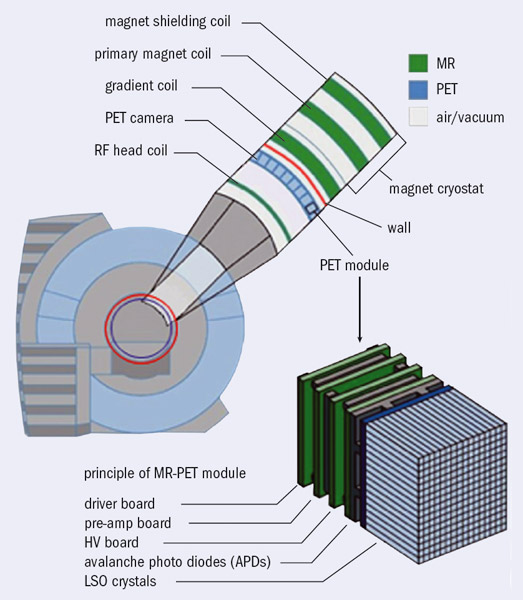
Scanner Construction.
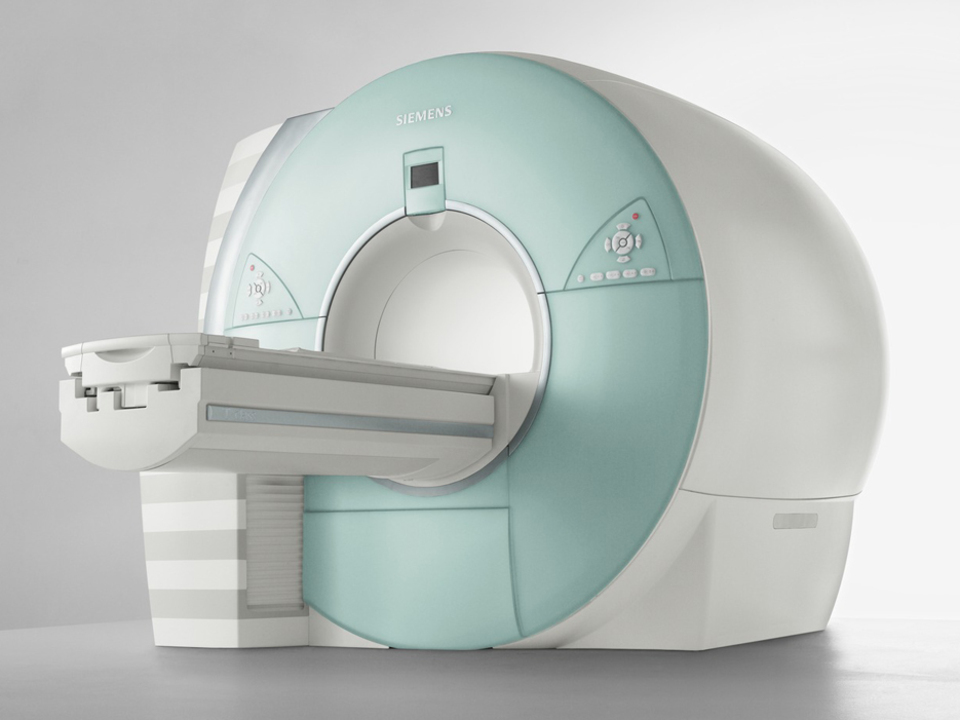
Siemens PET – MRI Scanner.
Architectural Design Issue
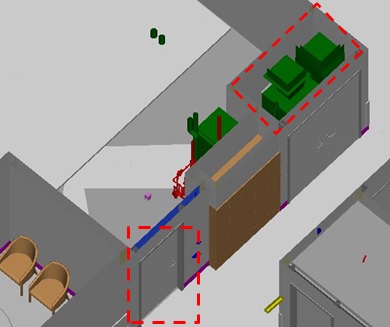
The DIU was originally designed (by the Architects BCJH) to be located on the ground floor but…and I can only presume due to lack of stakeholder engagement even though BCJH are an amalgamation of specialist hospital design architects so should know better, that particular area was right above the upper basesment car park as the red dotted rectangle (PET MRI room) depicts below when comparing both ground and upper basement floors. The blue dotted rectangle being the new location sufficient distance from the car parking spaces below.
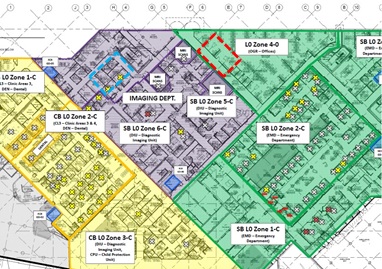
Ground Floor – DIU dept shaded purple.
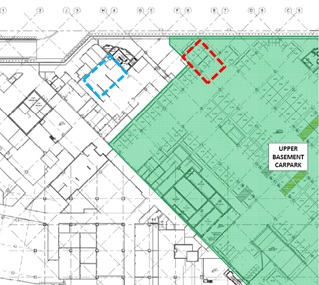
Upper Basement – Carpark in shaded green.
The issue is that each MRI room emits a large electric field as a result of the MRI technology using super strength magnets. Due to the design of the magnets, being symmetrical, the electric charge produced, found using Gauss’ Law as the below pic shows, creates some very serious problems. In simplistic terms the electric field is so great that there are limits to the proximity of moving (dynamic) metal objects in order for the scanner to work correctly and not have the metal objects causing discrepancies in the scan results. So you can imagine the surprise when the clinical technicians (stakeholders) found out about a carpark full of potentially huge dynamic metal objects right beneath their scanners. The Gauss Field seen in the pic below isn’t of the PET MRI room but of another MRI room for illustration purposes – the 0.5 mT (red field line) is the one that can affect humans and metal objects (like people walking past with a pacemaker fitted) and so is the one that must be contained in the Faraday cage. As a rough comparison your standard vacuum cleaner (generally emitting the highest magnetic field strength of any appliance found in the household) gives out 0.13 – 2 µT at a distance of 1m away vs a MRI scanner giving out 10 – 20 mT at 1m away. The MRI scanner being x 103 (1,000 times) higher but the exposure time of the MRI scanner is seconds versus minutes when operating a vacuum cleaner.
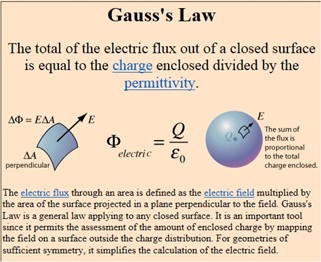
Gauss’ Law.
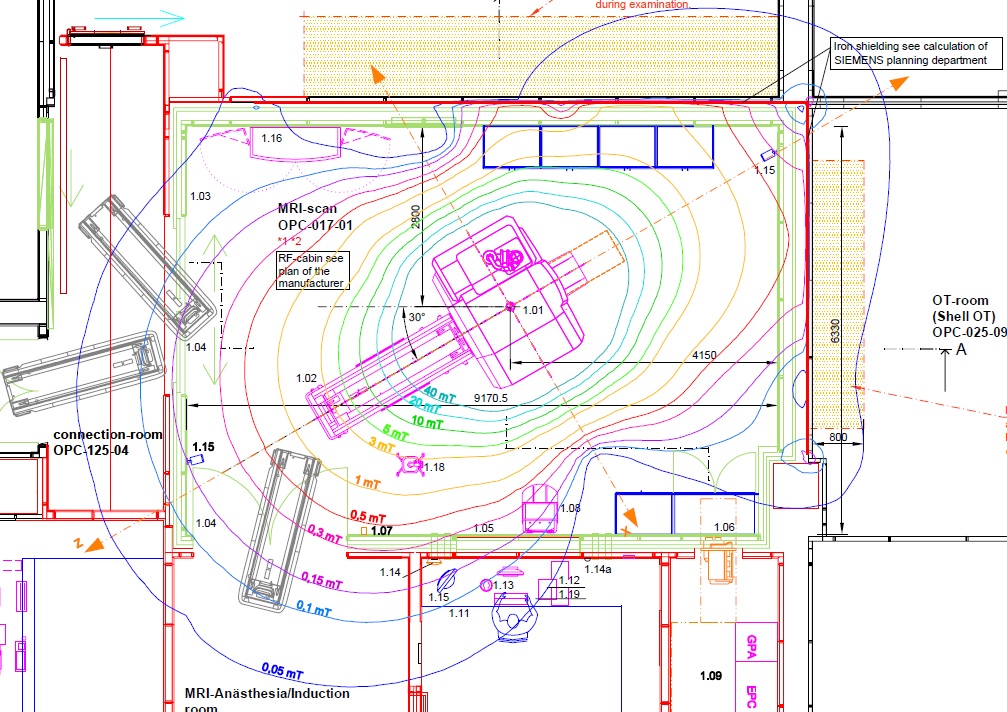
Gauss Field of MRI Scanner.
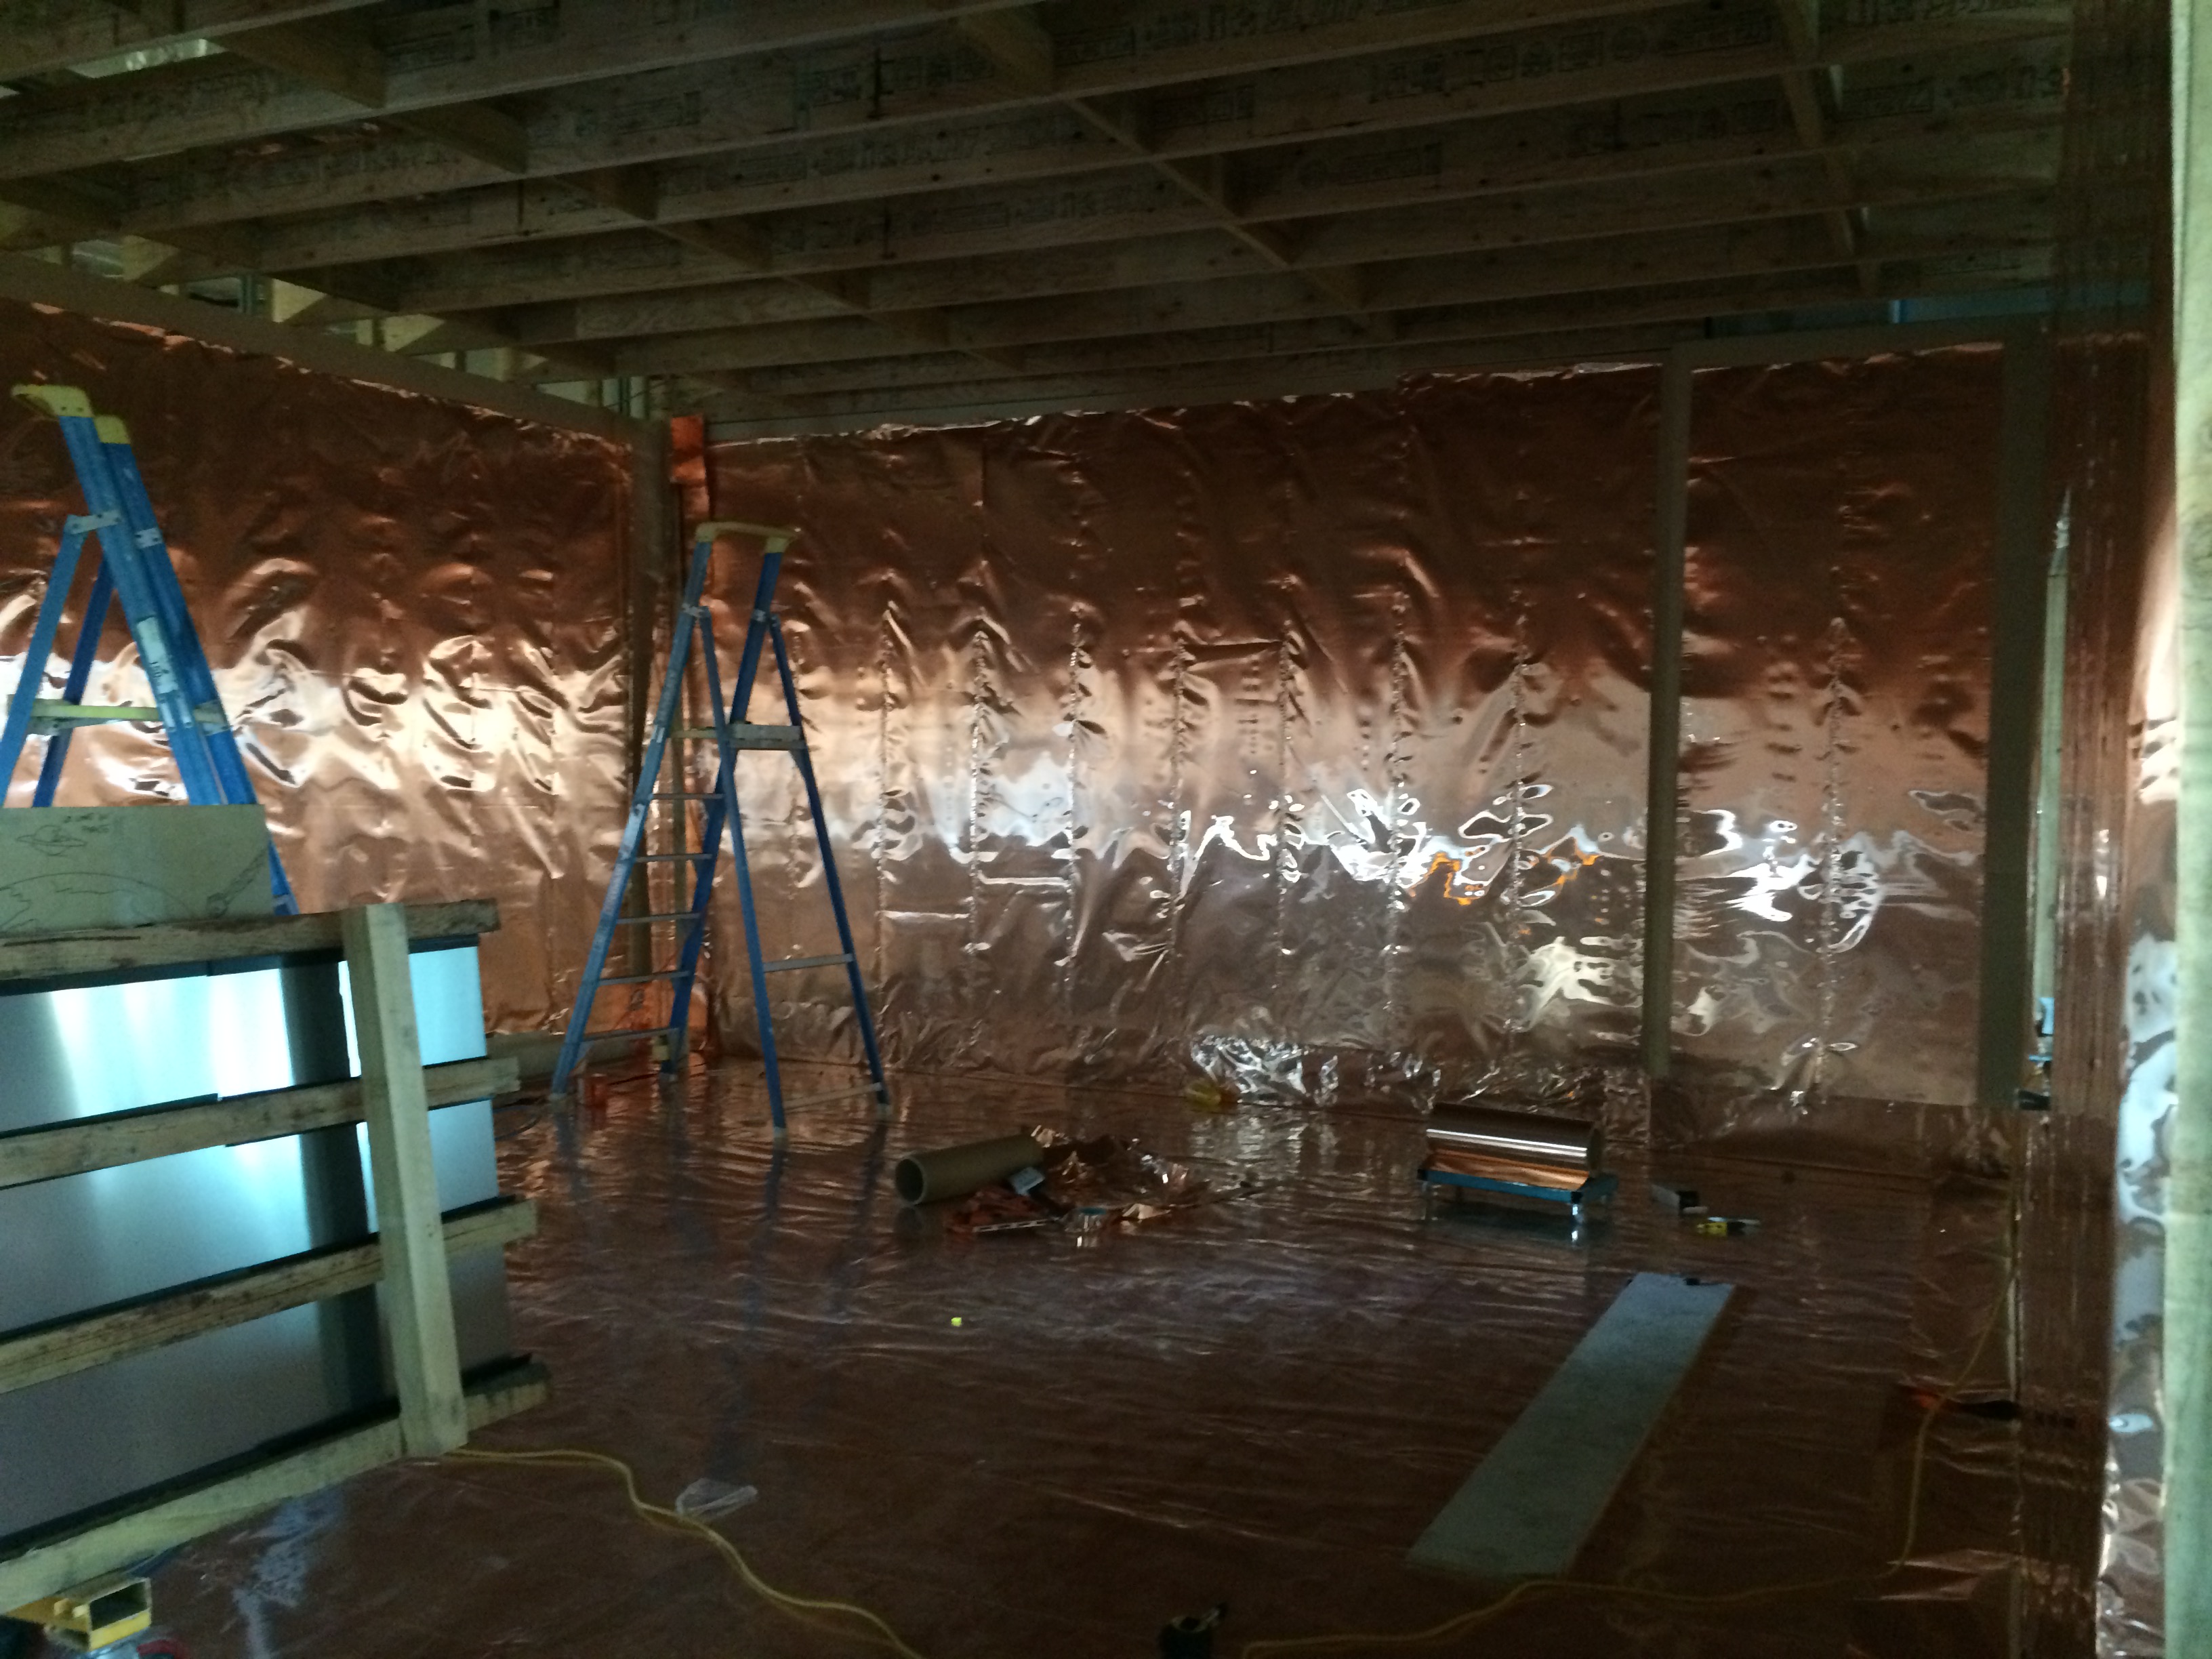
To reduce the effects of the Gauss field a faraday cage is constructed made of copper sheeting that is attached to the inside of the room via wooden battens and acts as a ‘force field’ surrounding the MRI scanner (charged particle) by basically conducting the charge thus stopping it spreading any further. However, the charge creates high levels of electromagnetic radiation which are potentially harmful and so a skin of silicon steel sheeting is attached to the outer side of the wooden battens in order to stop it. This construction is the same all the way around the scanner with the only slight difference being how it is placed into the floor. The pic below shows the set-down (72mm cut-out) in the concrete slab where the 6mm silicon steel sheets are placed followed by 19mm particleboard acting as a divider before the copper sheeting is added. Finally a 16mm particleboard, a 12mm particleboard and a 3mm vinyl sheet flooring are added coming up flush to avoid any raised edges in the finished floor (required for trolley wheels and eliminating as a trip hazard).
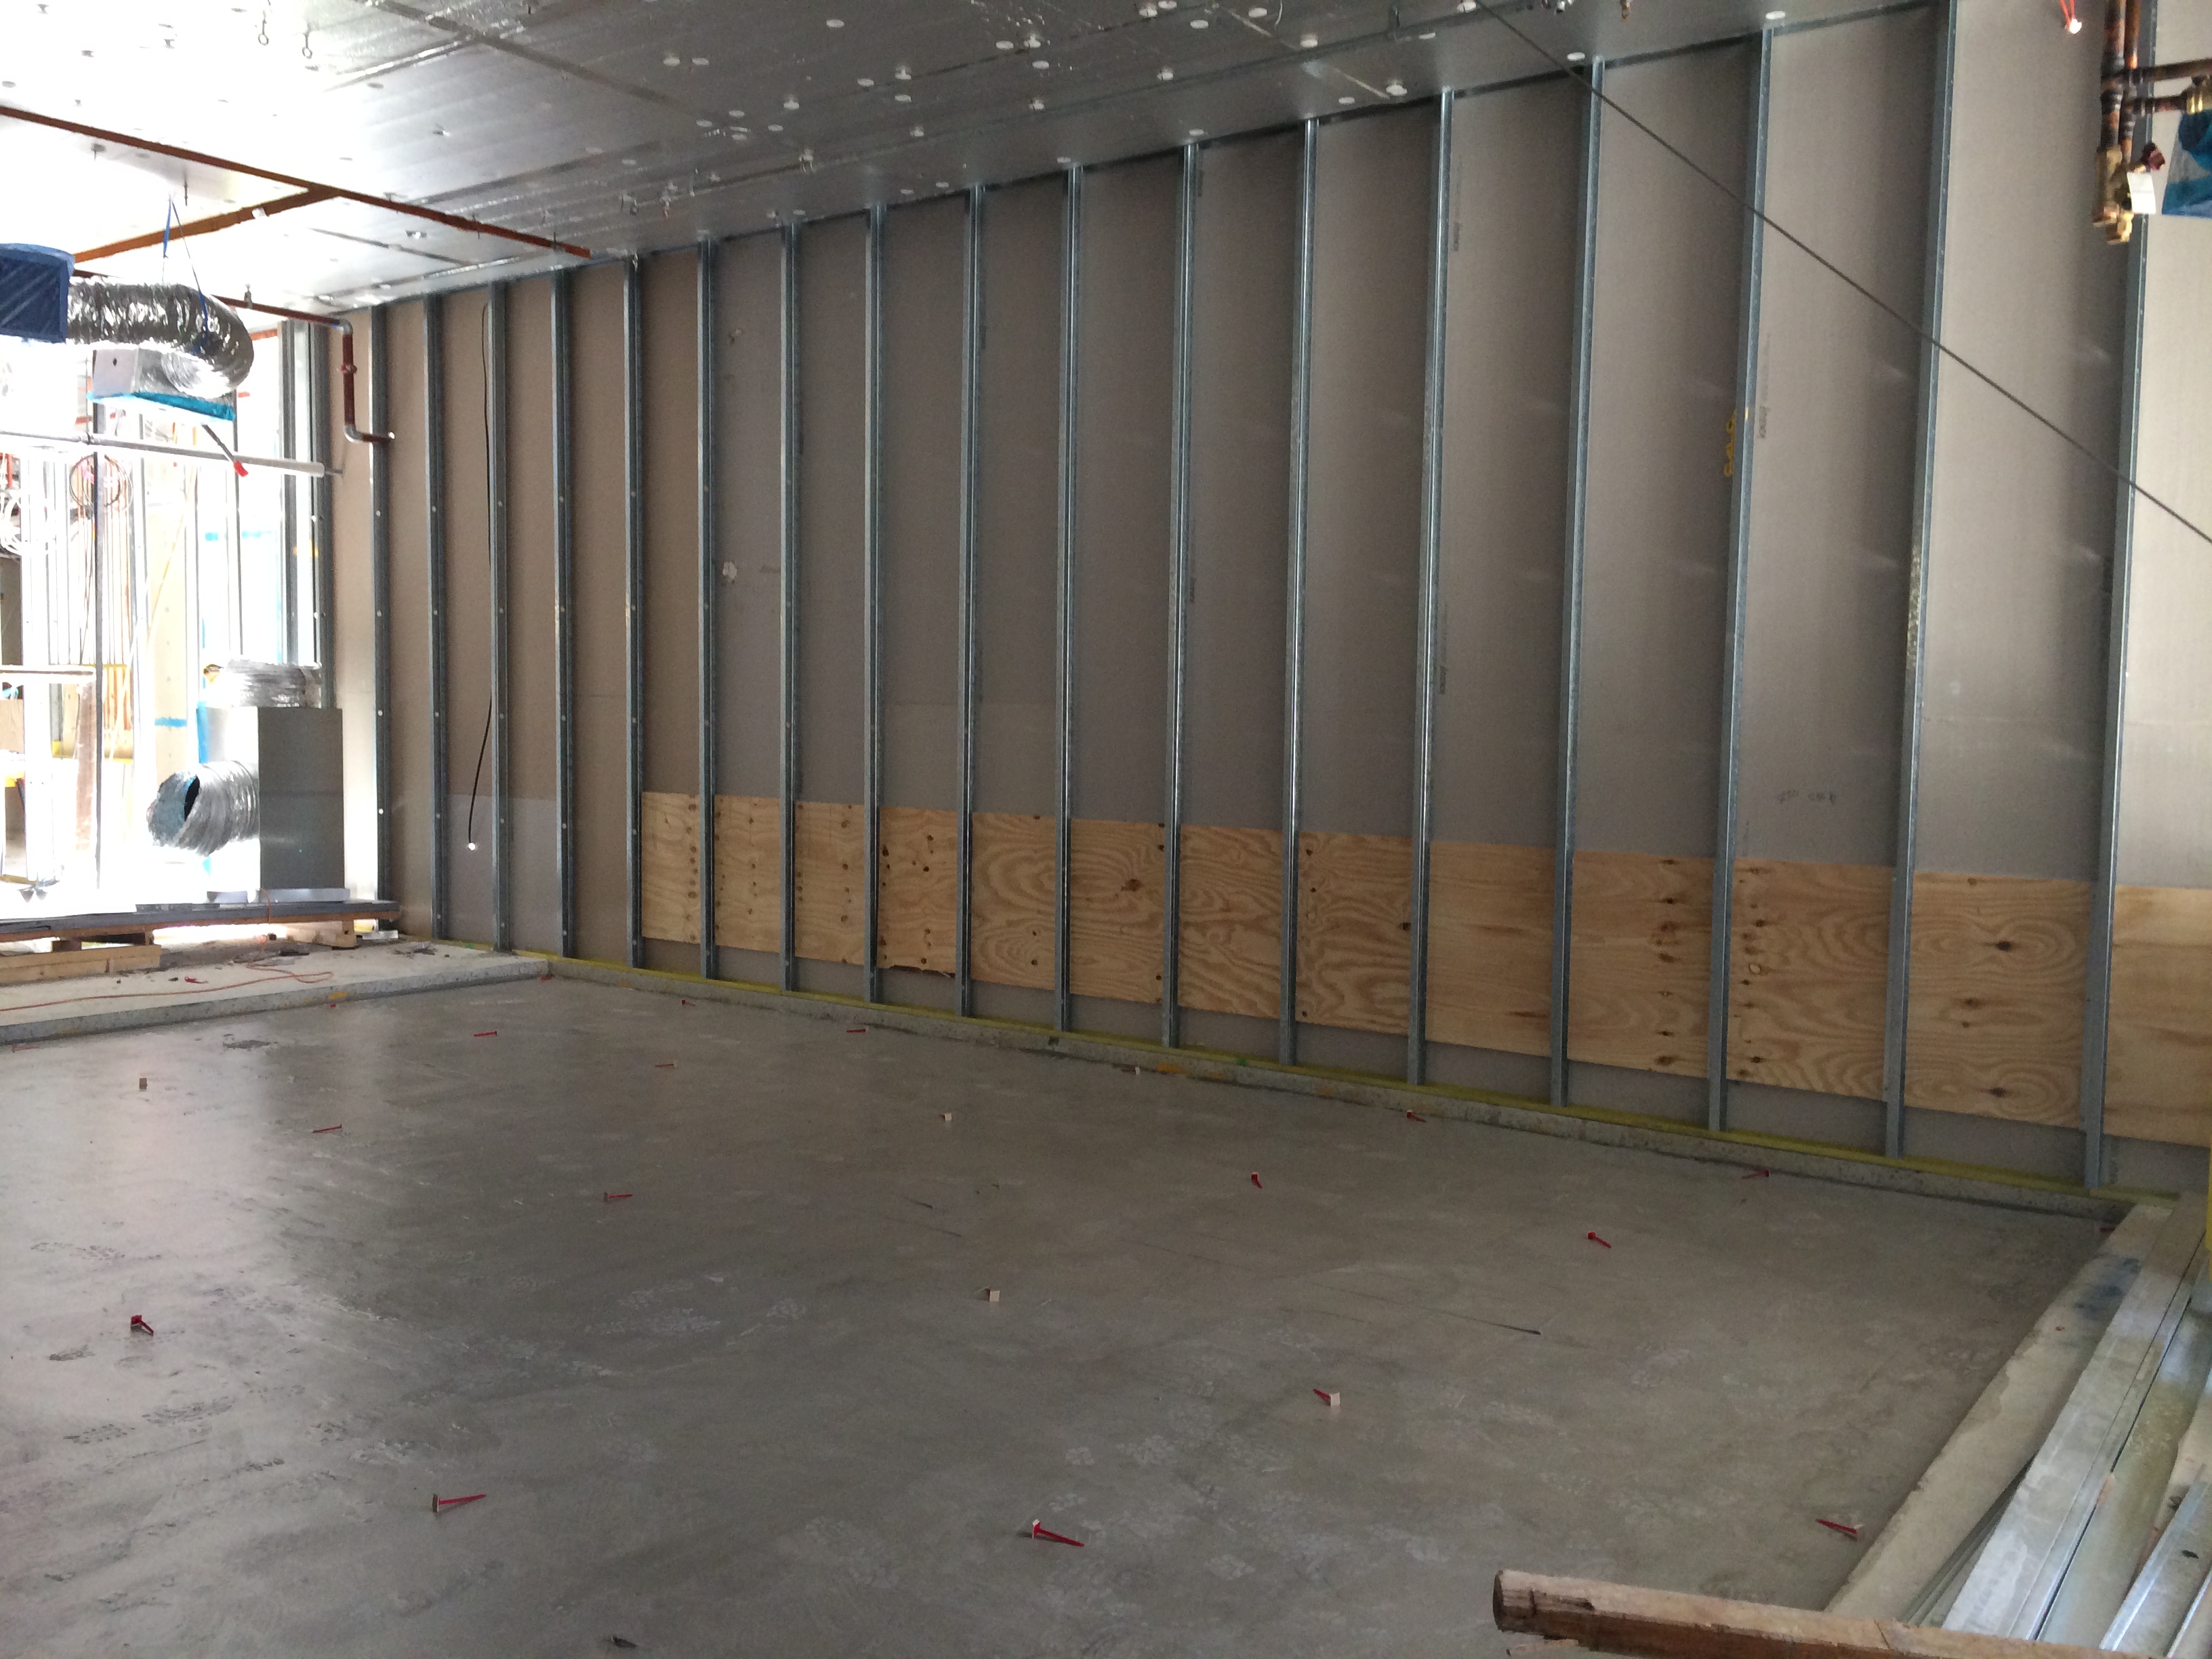
PET- MRI Room showing Set-down in the concrete slab.
MRI Room showing the Copper Faraday Cage.
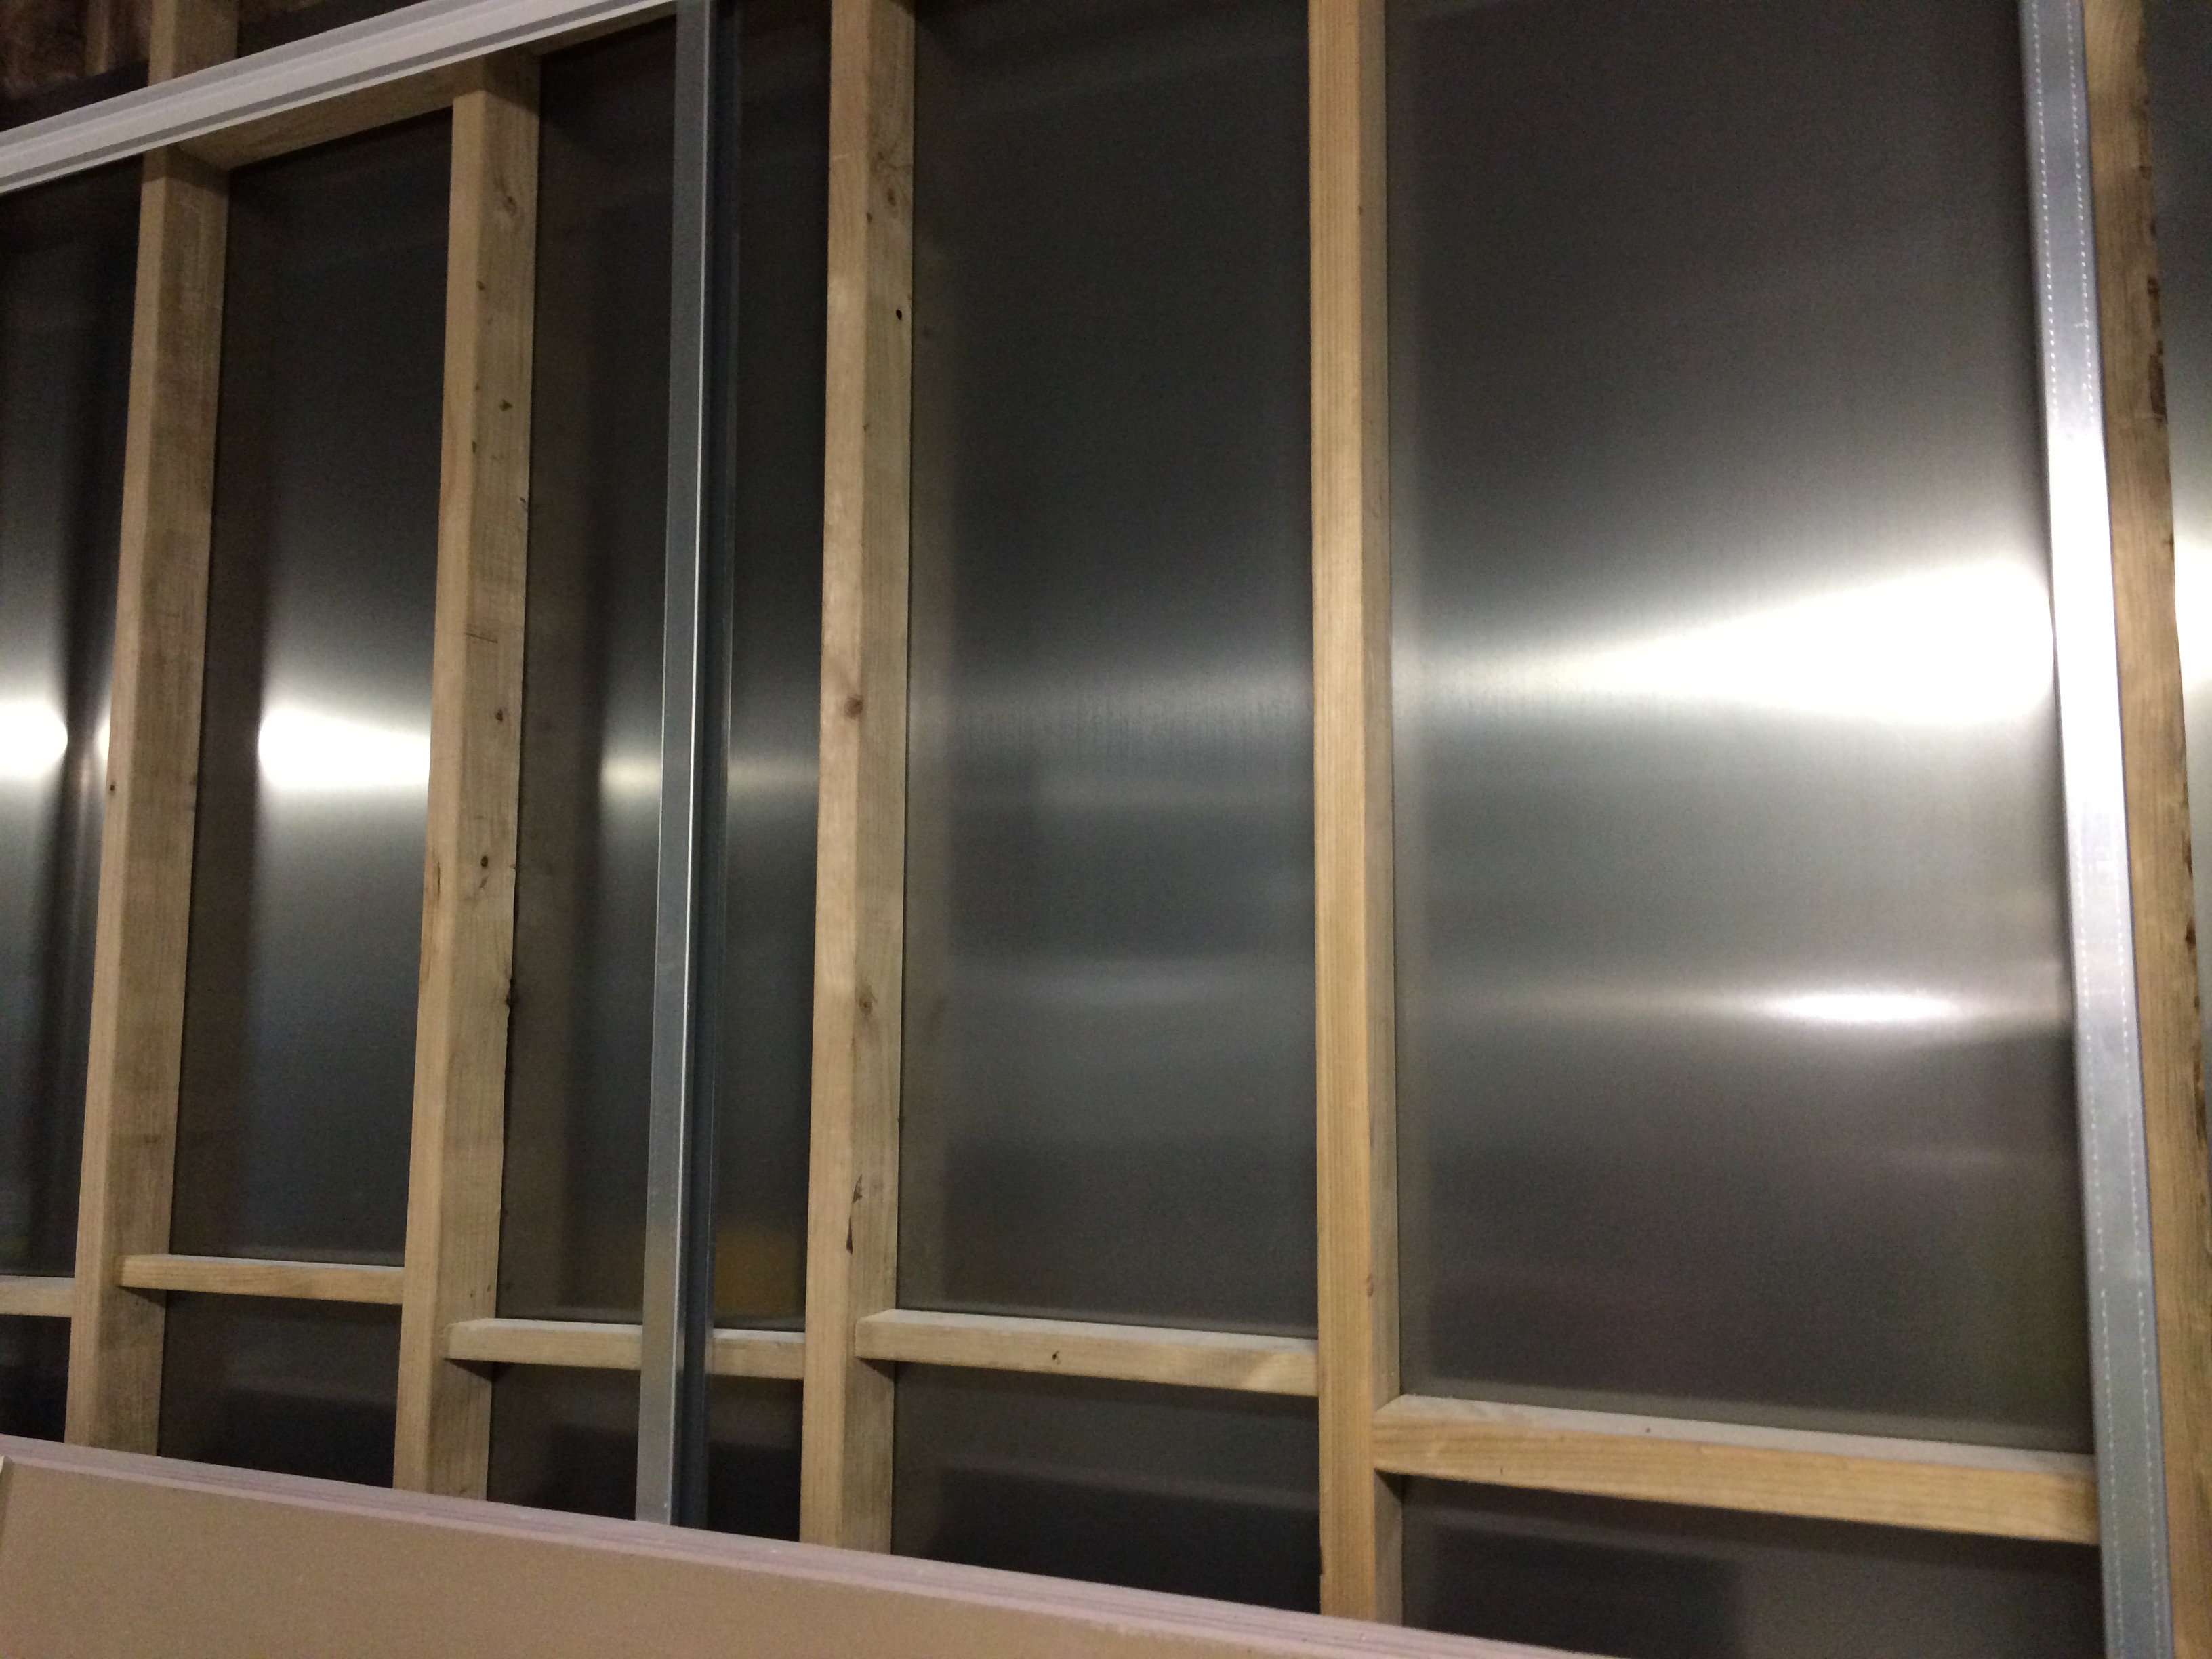
MRI Room showing the Silicon Steel Sheeting from the outside.
So although the faraday cage should stop the electric field getting out there are still obviously key technical design reasons why you don’t want it sat on top of tens of tonnes of metal cars moving around causing dynamic interference. This could be a good technical TMR topic, something like ‘what technical considerations should be investigated in the design and construction of a MRI room in a hospital and what design provides the best protection’?
Solution
A very expensive complete department move. Due to the functional interoperability of the department you couldn’t just relocate the MRI rooms per se but the entire department. The DIU is still on the same floor but now moved away from any potential dynamic mass of metal. Contractually JHG have put in a claim to the architects as moving the whole department has/will cost $ hundreds of thousands.
Knock-on Effects
Apart from having to redesign the layout of that particular area of the floor, including the requirement to fill what was going to be a source of natural light through an architecturally pretty glass roof will concrete, other building services issues arose.
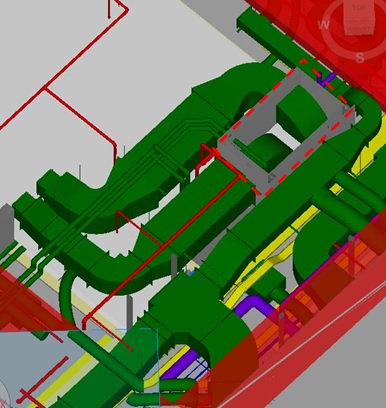
The BIM federated model below shows part of the PET MRI room. The orange rectangle is where a partition wall is yet to go up that divides the scanner room to the left and the electronics room (red dotted rectangle) to the right. In here the larger green box in the enclosed walls houses a Fan Coil Unit (FCU) for that floor area, the smaller green box is the dedicated cooling unit for that electronics room and the red piping/blob (barometric damper) is the pre-action fire suppression sprinkler system which had to change from a normal automatic wet sprinkler system so as to avoid potential water damage to the PET MRI scanner (approx. $2 million) meaning the barometric damper could not be put in the actual room due to the faraday cage.
BIM Federated Model of PET – MRI Room and Electronics Room.
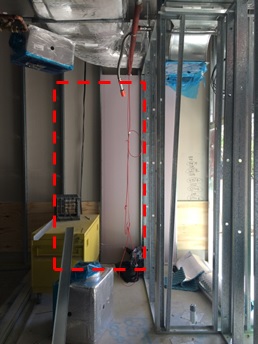
The on-site photo below (taken from the edge of the partition wall) shows the internal framework of the surrounding walls – you can make out the FCU compartment (dotted red line) and the ductwork, insulated supply (blue arrow) and extract (red arrow).
Electronics Room showing FCU location and ductwork.
The issue is that Siemens need to install their electronic equipment in this room (including the electrical safety working zones required) and are fighting for space even using the partition wall (orange rectangle). What’s making the situation worse is that FCU has been installed 180 degrees round the wrong way making the inspection/maintenance access doors completely redundant and requiring extra door panels on the inside of the room as seen by the grey arcs depicting the swing radius of the two inspection/maint panels in the BIM model above. Below shows the original FCU access doors and the main room door which is now planned to be outward opening (into the corridor) and moved round the corner.
Electronics Room – Corridor View with current door location.
The proposed new door location, shown below (red dotted line not to scale) will just fit at 1m in width.
Proposed new door location.
The obvious solution would be to turn the FCU round by 180 degrees so the inspection/maint panels marry up with the access doors however as shown in the model below and first photo the supply and return ductwork is already installed and there is no space or desire to change as this would be costly. Siemens have now been tasked to detail exactly what wall space they require for their equipment in order to resolve the issue.
BIM Model of Ductwork in ceiling space.
The below annotated dwg is the proposed solution for Siemens and we are awaiting their final decision. Note the faraday cage (dashed green line around the perimeter of the scanner room) and in the electronics room the green boxes are the location of equipment with the orange boxes being the safe working zones so you can see how tight it is. Also, the shaded green boxes are the space gained by relocating the door round the corner so Siemens should be satisfied.
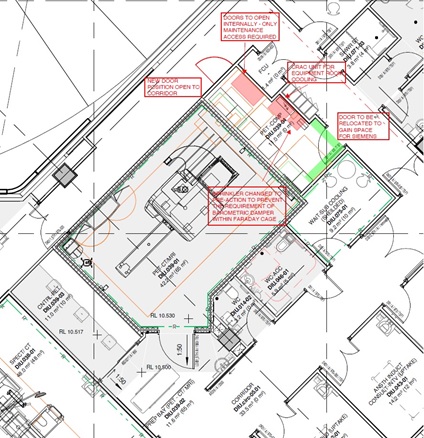
Shop Drawing of relocated electronics room access door and FCU maint doors.
Oz PCH – Smokey and the Bandit
This week, amongst other tasks, I have started on one of my main project responsibilities; that of managing the Cause & Effect (C&E) Matrix. The C&E Matrix details all the outcomes required of certain building services systems in the event of a fire, like; smoke management; lift function and door access control. The fires suppression and alarm systems being managed separately. The obvious priority in a fire situation is preservation of life but in a hospital you can’t start wheeling hundreds of beds down corridors in order to save little johnnies’ life and there will be a number of patients in various states of critical conditions where they are hooked up to all manner of support systems, so staged zonal evacuation is required and extinguishing the fire becomes a very close second priority. However, the biggest killer in a fire situation is smoke inhalation.
Cause & Effect Smoke Management
Who’s who?
Advanced Solutions (AS) – Smoke Management Services.
Schneider – Technology Interface.
NDY – Design Consultancy Sub-contracted to JHG.
The System
I attended my first C&E mtg, this one regarding just the smoke management in a fire situation and to be honest I didn’t really fully understanding the systems in place and found a lot of the detail going straight over my head. However, post mtg and with a little explanation from my LM it started to become clear.
In the event of a fire the smoke created as a result provides the easiest means of detection, especially when you consider a fire could break-out in any room throughout the vast number found in a hospital and potentially in a non-occupied one with no-one present to see the flames and hit the alarm. Smoke, being a by-product of the fire is hotter than the surrounding air and so rises thus making it easier to detect from high level (usually ceiling) mounted detectors. I’m not going to discuss the methods used for confirming the fire, extinguishing it and the alarm systems here so will leave that for subsequent blogs. What I am going to cover is how the smoke management system was designed to work and its operation.
The building is provided with a zone smoke control system throughout. The zone smoke control system utilises the return air system of the air-conditioning as smoke spill (detection). In support of the building’s zonal smoke control strategy, all of the significant AHUs within the building will be used to control and limit smoke migration. When smoke is detected in a fire-affected zone it uses an extraction system to remove it from that zone and simultaneously shuts down the air supply (via the AHUs) to create negative (-ve) pressure imbalance in that zone. Supplementary to this, air supply fans in adjacent zones ramp up and the extraction fans close thus creating positive (+ve) pressurisation in order to ensure inward migration of clean, smoke-free air into the fire-affected zone which assists in keeping the egress paths relatively clear of smoke.
All fire management systems should be powered from the Essential Supply (ES) because the ES is backed-up by the stand-by generators (UPS) so in a fire situation the ES is more likely to remain functional over the Non-Essential Supply (Non-ES) which isn’t backed-up. The two systems then operate; the extraction sys by controlling fans to extract smoke out of the building; and the pressurisation sys by controlling the Air Handling Units (AHUs) and various dampers/fans. The fire zones generally coincide with the AHU zones and it is these that determine the various AHU behaviours in the event of a fire, although some adjacent zones may not contribute towards zone pressurisation e.g. adjacent zones crossing the atrium from East to West Towers – see below examples of AHU zonal layout of the ground level and level 2.
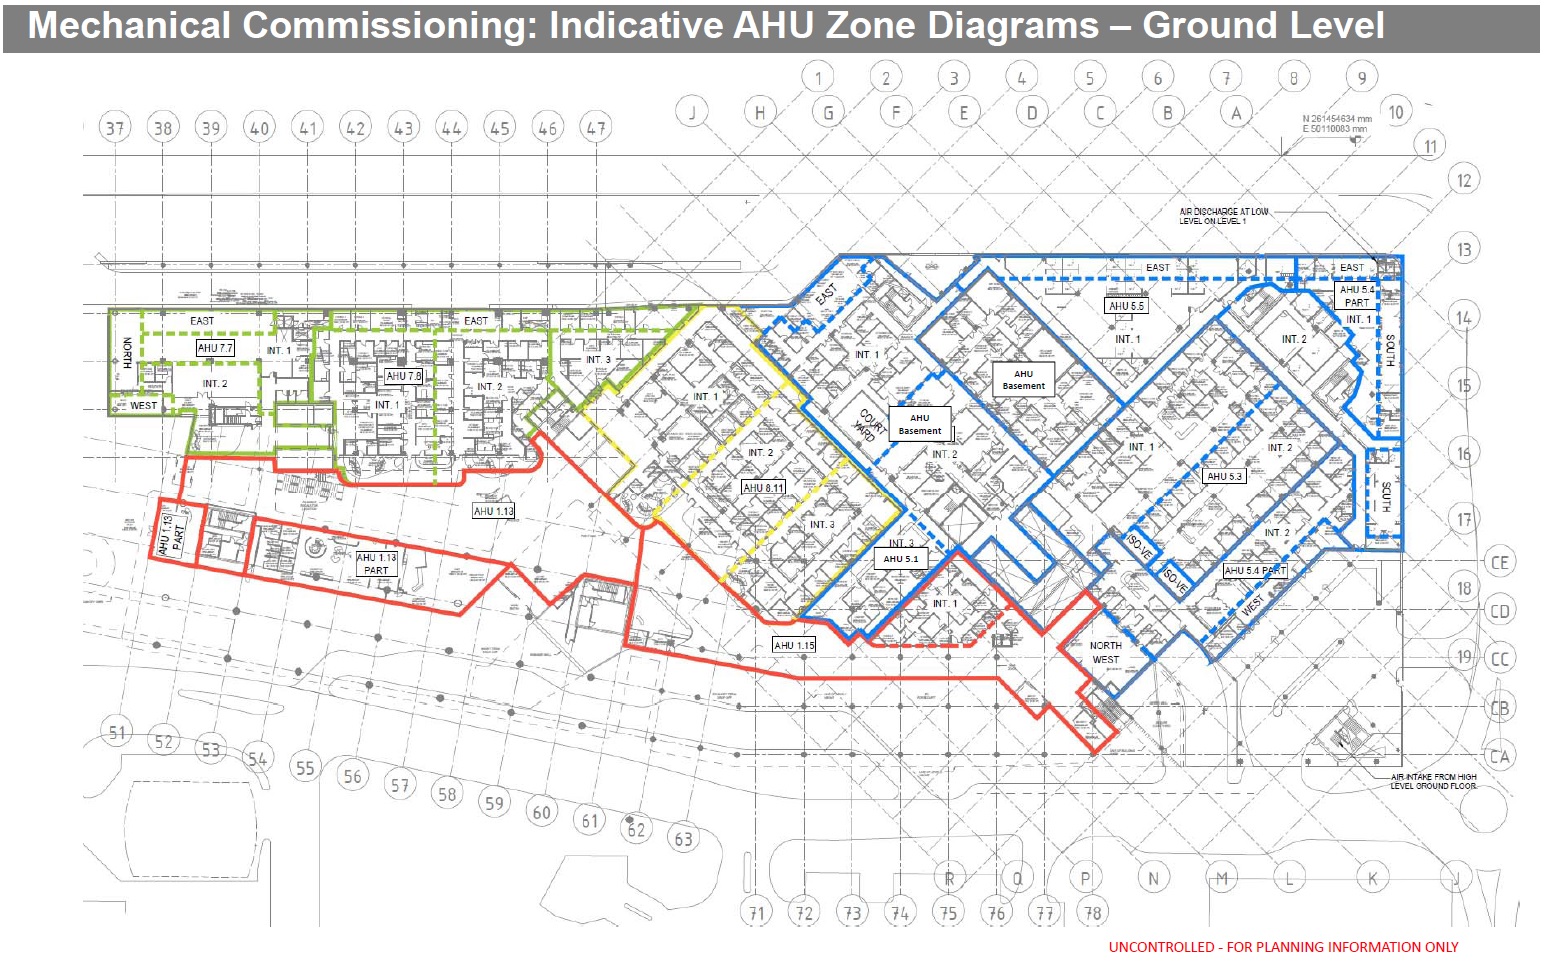
Ground Level AHU layout by zones.
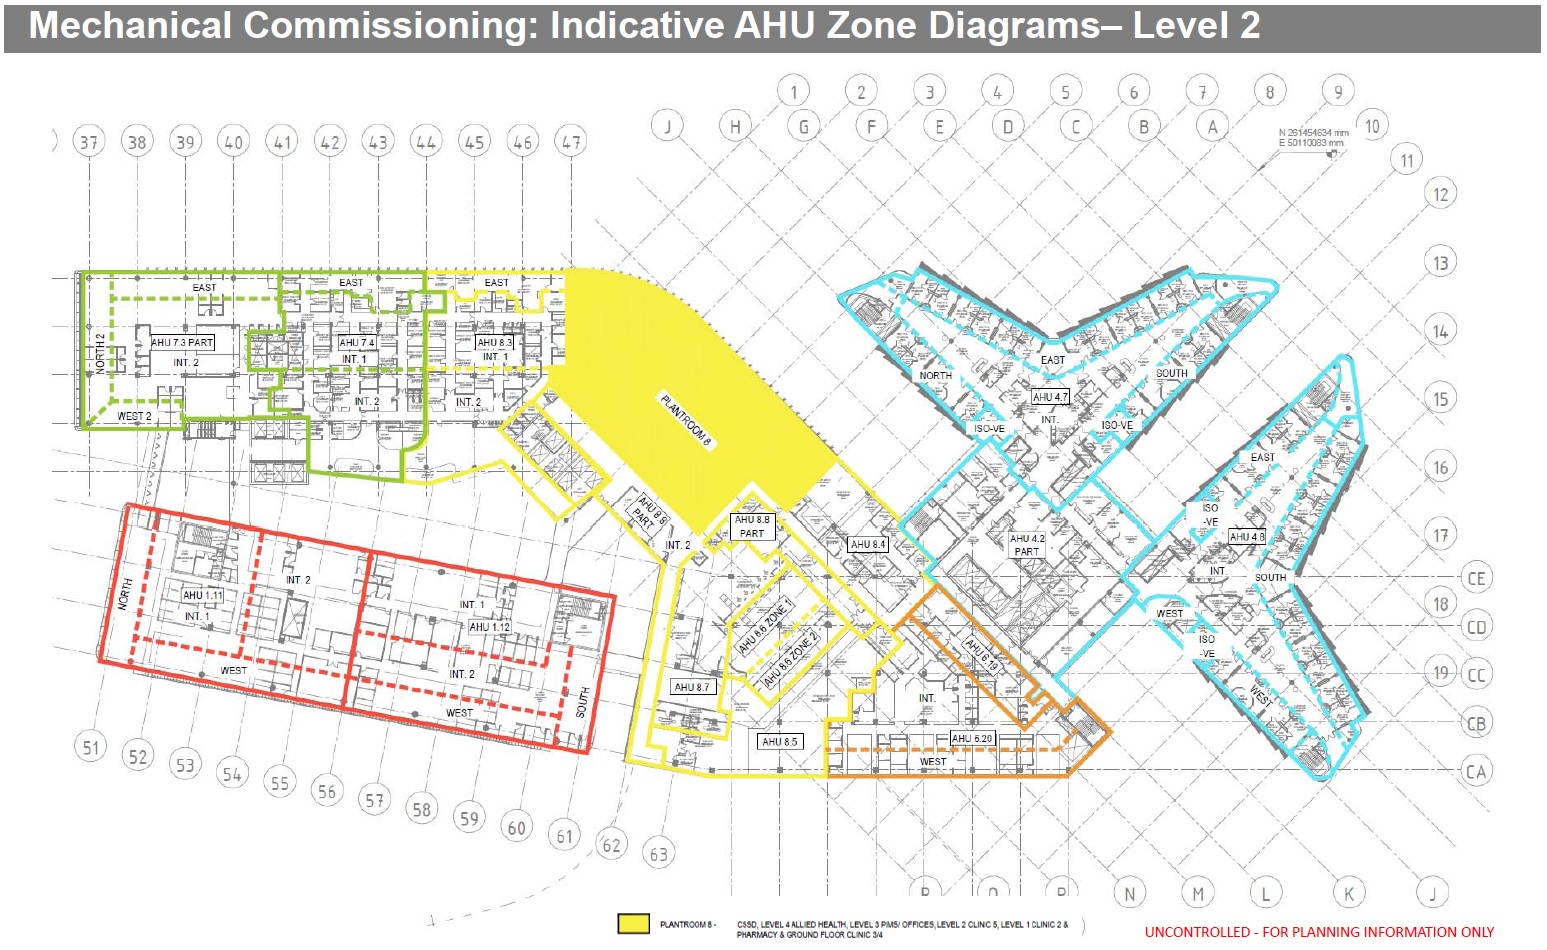
Level 2 AHU Zones – You can see pressurising West Block zone (red) will not positively affect the East Block zone (green) as the atrium in the middle will prohibit effectiveness.
The Issue
In order to control the zones both extraction and positive pressurization are used to create a pressure differential of not less than 20Pa (20N/m2) but not more than 100Pa (100N/ m2) between any single fire-affected zone and its adjacent non-fire-affected zones in accordance with the requirements of AS/NZS1668.1:1998 (Australia and New Zealand’s Standard for the use of ventilation and air-conditioning in buildings – Fire and smoke control in multi-compartment buildings). 20Pa is actually quite a lot of differential across a doorway and would require quite a high air flow rate to achieve this. The maximum being 100Pa is due to the required force to open a door is not permitted to exceed 110N. It is generally accepted that for most applications a positive pressure of around 20Pa in non-fire-affected compartments with respect to the fire-affected compartment will minimize the spread of smoke. A higher pressure should be designed for where ceiling heights exceed 3m; 40Pa is suggested for 6m high ceilings. Using both systems allow the greatest amount of flexibility when concerning complex zonal layouts where certain rooms (dependant on their designed use) are a higher priority than others to remain smoke free (see rough sketch below). However, it is possible to create the required pressure differential from extraction alone but it offers less flexibility and may even be impossible in certain scenarios (see basic differences between systems in the second pic below).
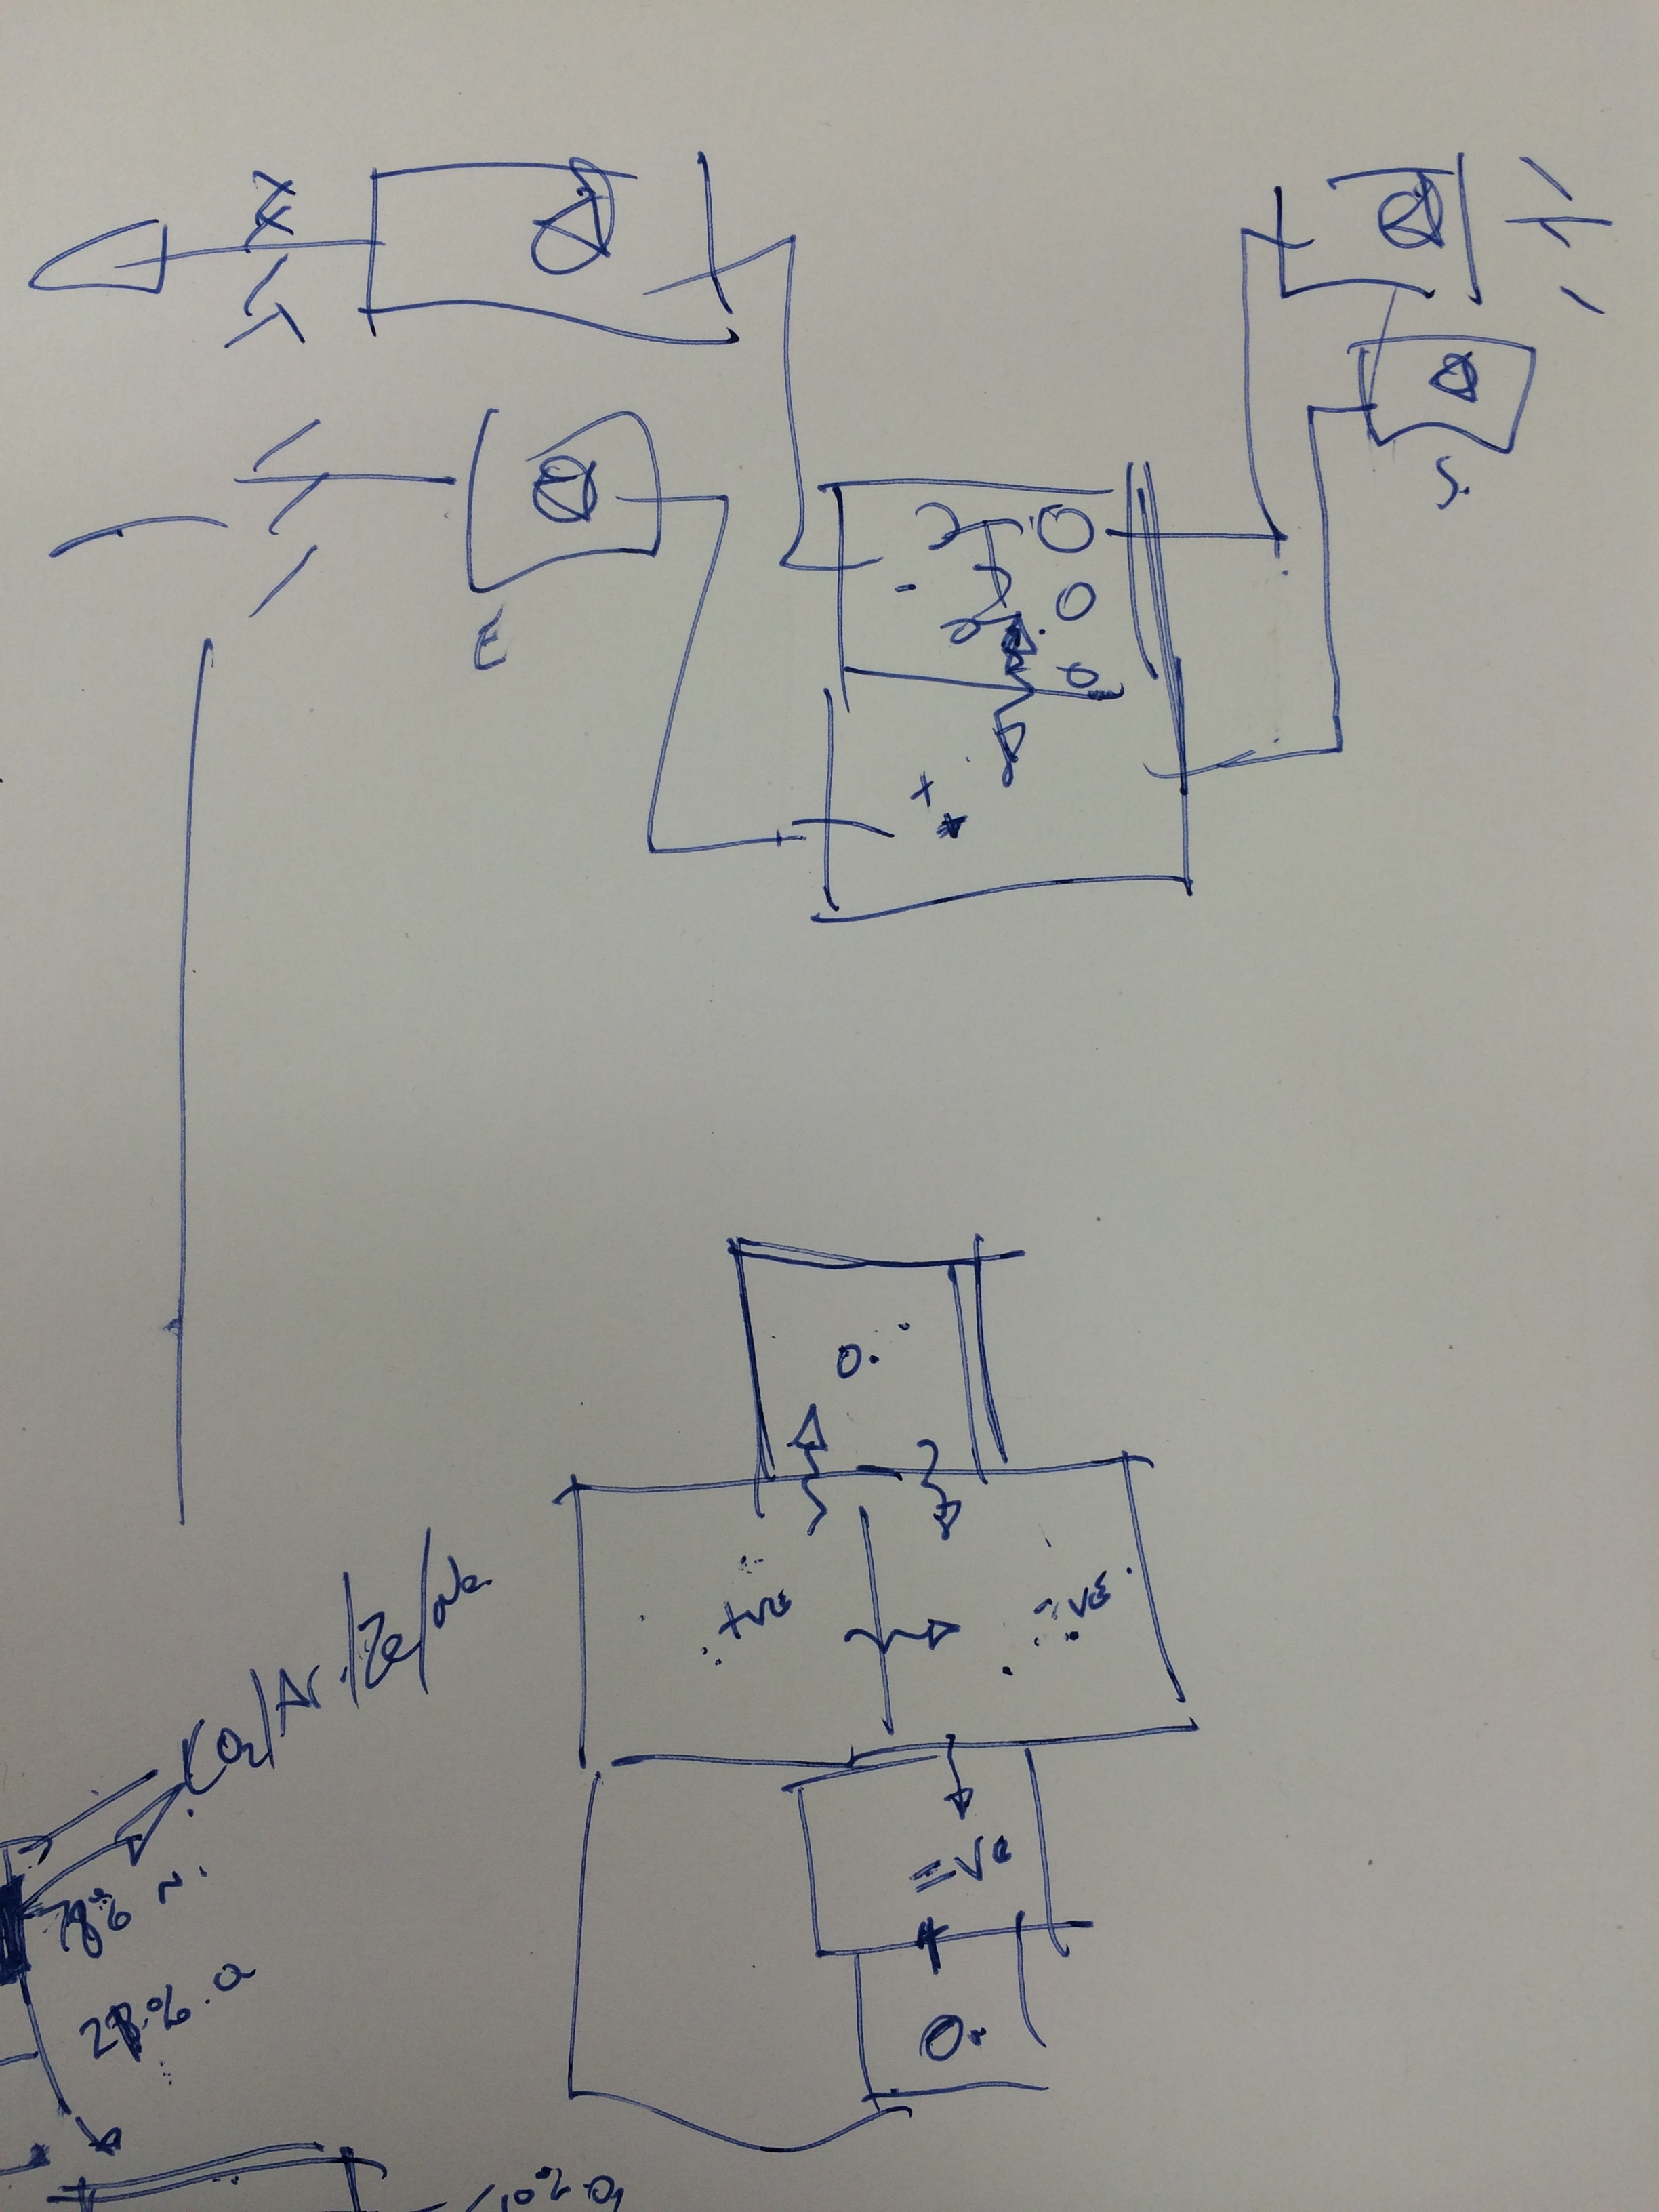
I know this sketch is very ‘Jonny age 5’ but in drawing it, it aided understanding in the potential complexities of adjacent rooms requiring different pressurisation.
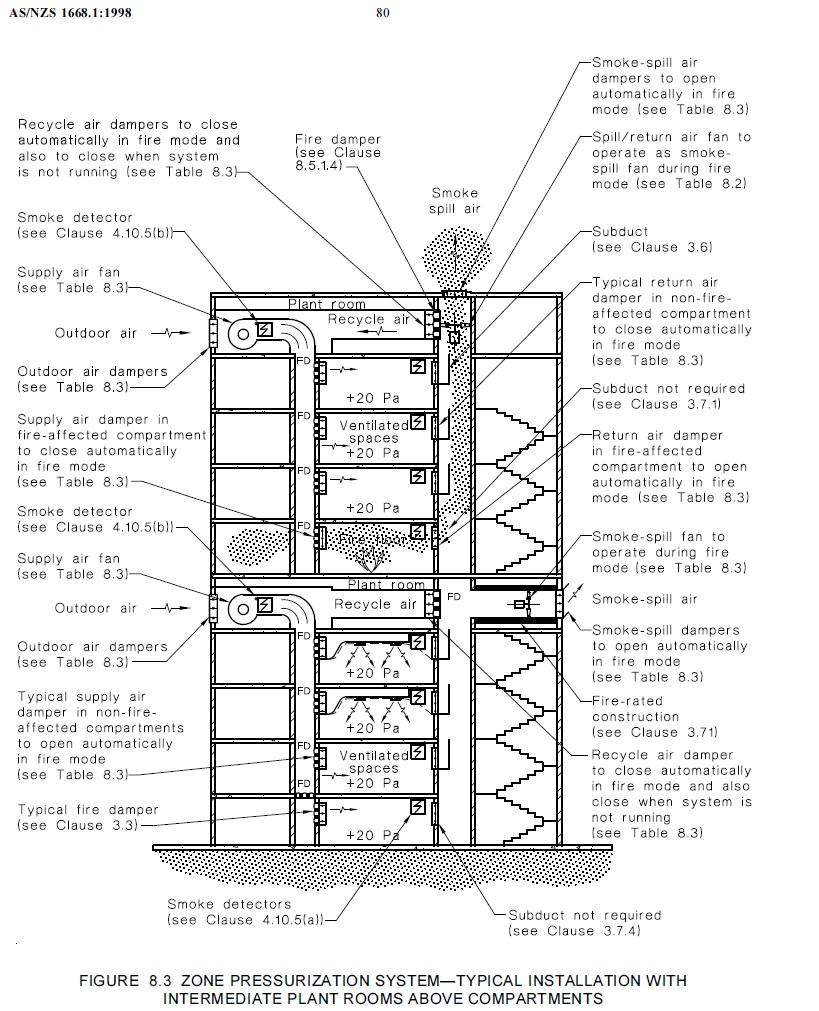
However this diagram (from the AS/NZS1668.1:1998) does explain pictorially how the two systems work together including what each type of damper should do in the event of a fire dependant on if the damper is in the fire-affected zone or not – this is indicative of building layout in the PCH project having plantrooms between levels.
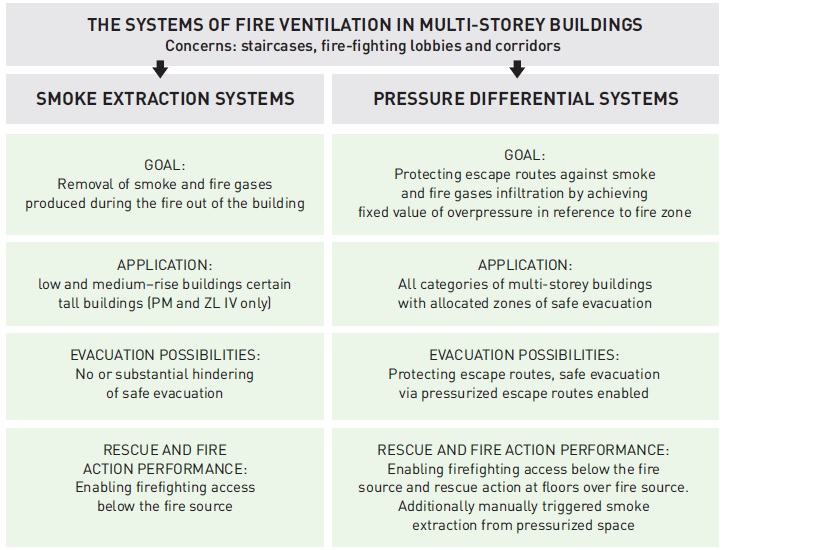
This is an extract from iSAFTEY WAY – Pressure Differential Systems in High-Rise Buildings describing the basic features of smoke extraction and pressure differential systems.
Therefore the design from NDY was to use both extract and positive pressurisation…and here’s comes the but…but approx. 40% (36) of the 91 x AHUs (see pic below) are on the Non-ES which could cause major problems because, as mentioned above, the Non-ES is not backed-up and thus if the fire damages the Non-ES, power to AHUs will be lost and thus not operate as intended.

AHU Layout across all levels and Blocks. Each box (less those that say Commissioning Plant Room) represents one or in some cases more AHUs.
The Solution
Our view is that all AHUs should be on the ES but NDY say they can achieve the required zonal pressurisation from extraction alone so we have asked the question for them to confirm that’s the case. If so then everything should be ok but if not then it’s a gargantuan problem and will cost hundreds of thousands to rectify in changing the power supply to approx. 60 x AHUs; which would consist of changing connection to different MSSBs, cabling etc, etc.
Once the above issue is sorted and the system can theoretically pressurise zonally either by only extract or a combination of the two systems then Advanced Solutions (AS) will ensure their control management is in place for all AHU dampers/fans to operate dependant on the requirement for a particular room/zone and thus manage the smoke.
The Hard Part
The hard part is in the testing of ALL AHUs and dampers/fans reacting as intended along with the other more onerous task of physically checking the other C&E systems work as intended, for example; ensuring that every door within or on the boundary of a fire compartment automatically disengages from its magnetic hold open device to close thus preventing the spread of smoke and fire and that non-fire rated motorised doors or smoke doors located on escape routes are to continue to operate as required until power failure at which point they are sprung loaded and will fail safe to the open position. Also allowing any secured access doors (via swipe card) to release on general fire alarm activation to ensure free egress. Additionally there are protocols for all other systems including; fire shutters and roller shutter doors; lifts; pneumatic tube system (carrying predominantly blood samples); gas supply; Automatic Guided Vehicles (AGVs); and miscellaneous systems, such as medical gas supply. The execution will be very time consuming and imperative that we get the recording of results right as the C&E Matrix forms part of the handover documentation for the Client and indeed the building users.
In Other News
I was shown this in the office and found it quite funny so thought I’d share it with you.
Oz PCH – Commissioning Jim but not as we know it…
Precommissioning Checks of Water Distribution Commissioning Valves
Who’s who?
Fredon – Mech Infrastructure Subcontractor (work areas includes; plant rooms, services risers and entire basement plant room).
Centigrade – Mech Fit-out Subcontractor (work area includes; floors and corridors).
Why two subcontractors installing the same equipment? Threefold; to reduce the risk attributable to one subcontractor; to reduce the workload to a more manageable % of the overall build; and to ensure one subcontractor wasn’t responsible for too much cost (Fredon’s contract was originally worth approx. AUS$40.7 million but more likely to be AUS$48 million and Centigrade’s originally AUS$27.2 million but more likely AUS$31 million). The important factor is ensuring each clearly understands their working boundaries.
The Issue
In order to commence testing and commissioning of the hot and cold water system, precommissioning checks state that commissioning valves need to be fixed in place in order to measure and balance the flow rates and thus prove the system. On inspection of a number of commissioning valves in a number of plant rooms it was found that they had been installed incorrectly – in some cases there wasn’t sufficient straight line pipe before or after the valve which would skew any readings taken. CIBSE commissioning code and NDY specifications stipulate the valve must be installed at min straight length of 10 x dia upstream and 5 x dia downstream of the valve (as below).

CIBSE Commissioning Code Standard.
However, checking the valve manufacturer, Tour & Andersson’s (TA), data sheet it stipulates the valve must be installed at min straight length of 5 x dia upstream (10 x dia if connected straight to a pump) and 2 x dia downstream of the valve, as shown below.
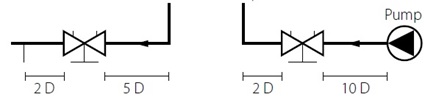
TA Commissioning Standard.
The manufacturer’s data sheets were checked in order to back up our argument (more on that later). Firstly you’ll notice a difference in the downstream length between what CIBSE (5x) and TA (2x) stipulate but you could argue that as the point at which the length is measured from is different, that actually the manufacturer (TA) is approx. 5 x dia when you add the length of the valve itself (approx. 3 x dia). Therefore, only the upstream lengths are different but TA does say 10 x dia if the flow is coming from a pump (essentially creating more turbulence than a bend or change in dia so requiring more length in which to settle back to a more laminar flow) and so worst case is to use 10 x dia upstream and 5 x dia downstream – which is what JHG and NDY stipulate.
In addition not only were the straight line distances incorrect but worse still the pipe line dia was different to the valve dia. In one case there was a 12.5mm dia pipe with a 20mm dia valve fitted in the middle. Below are examples of what was found.
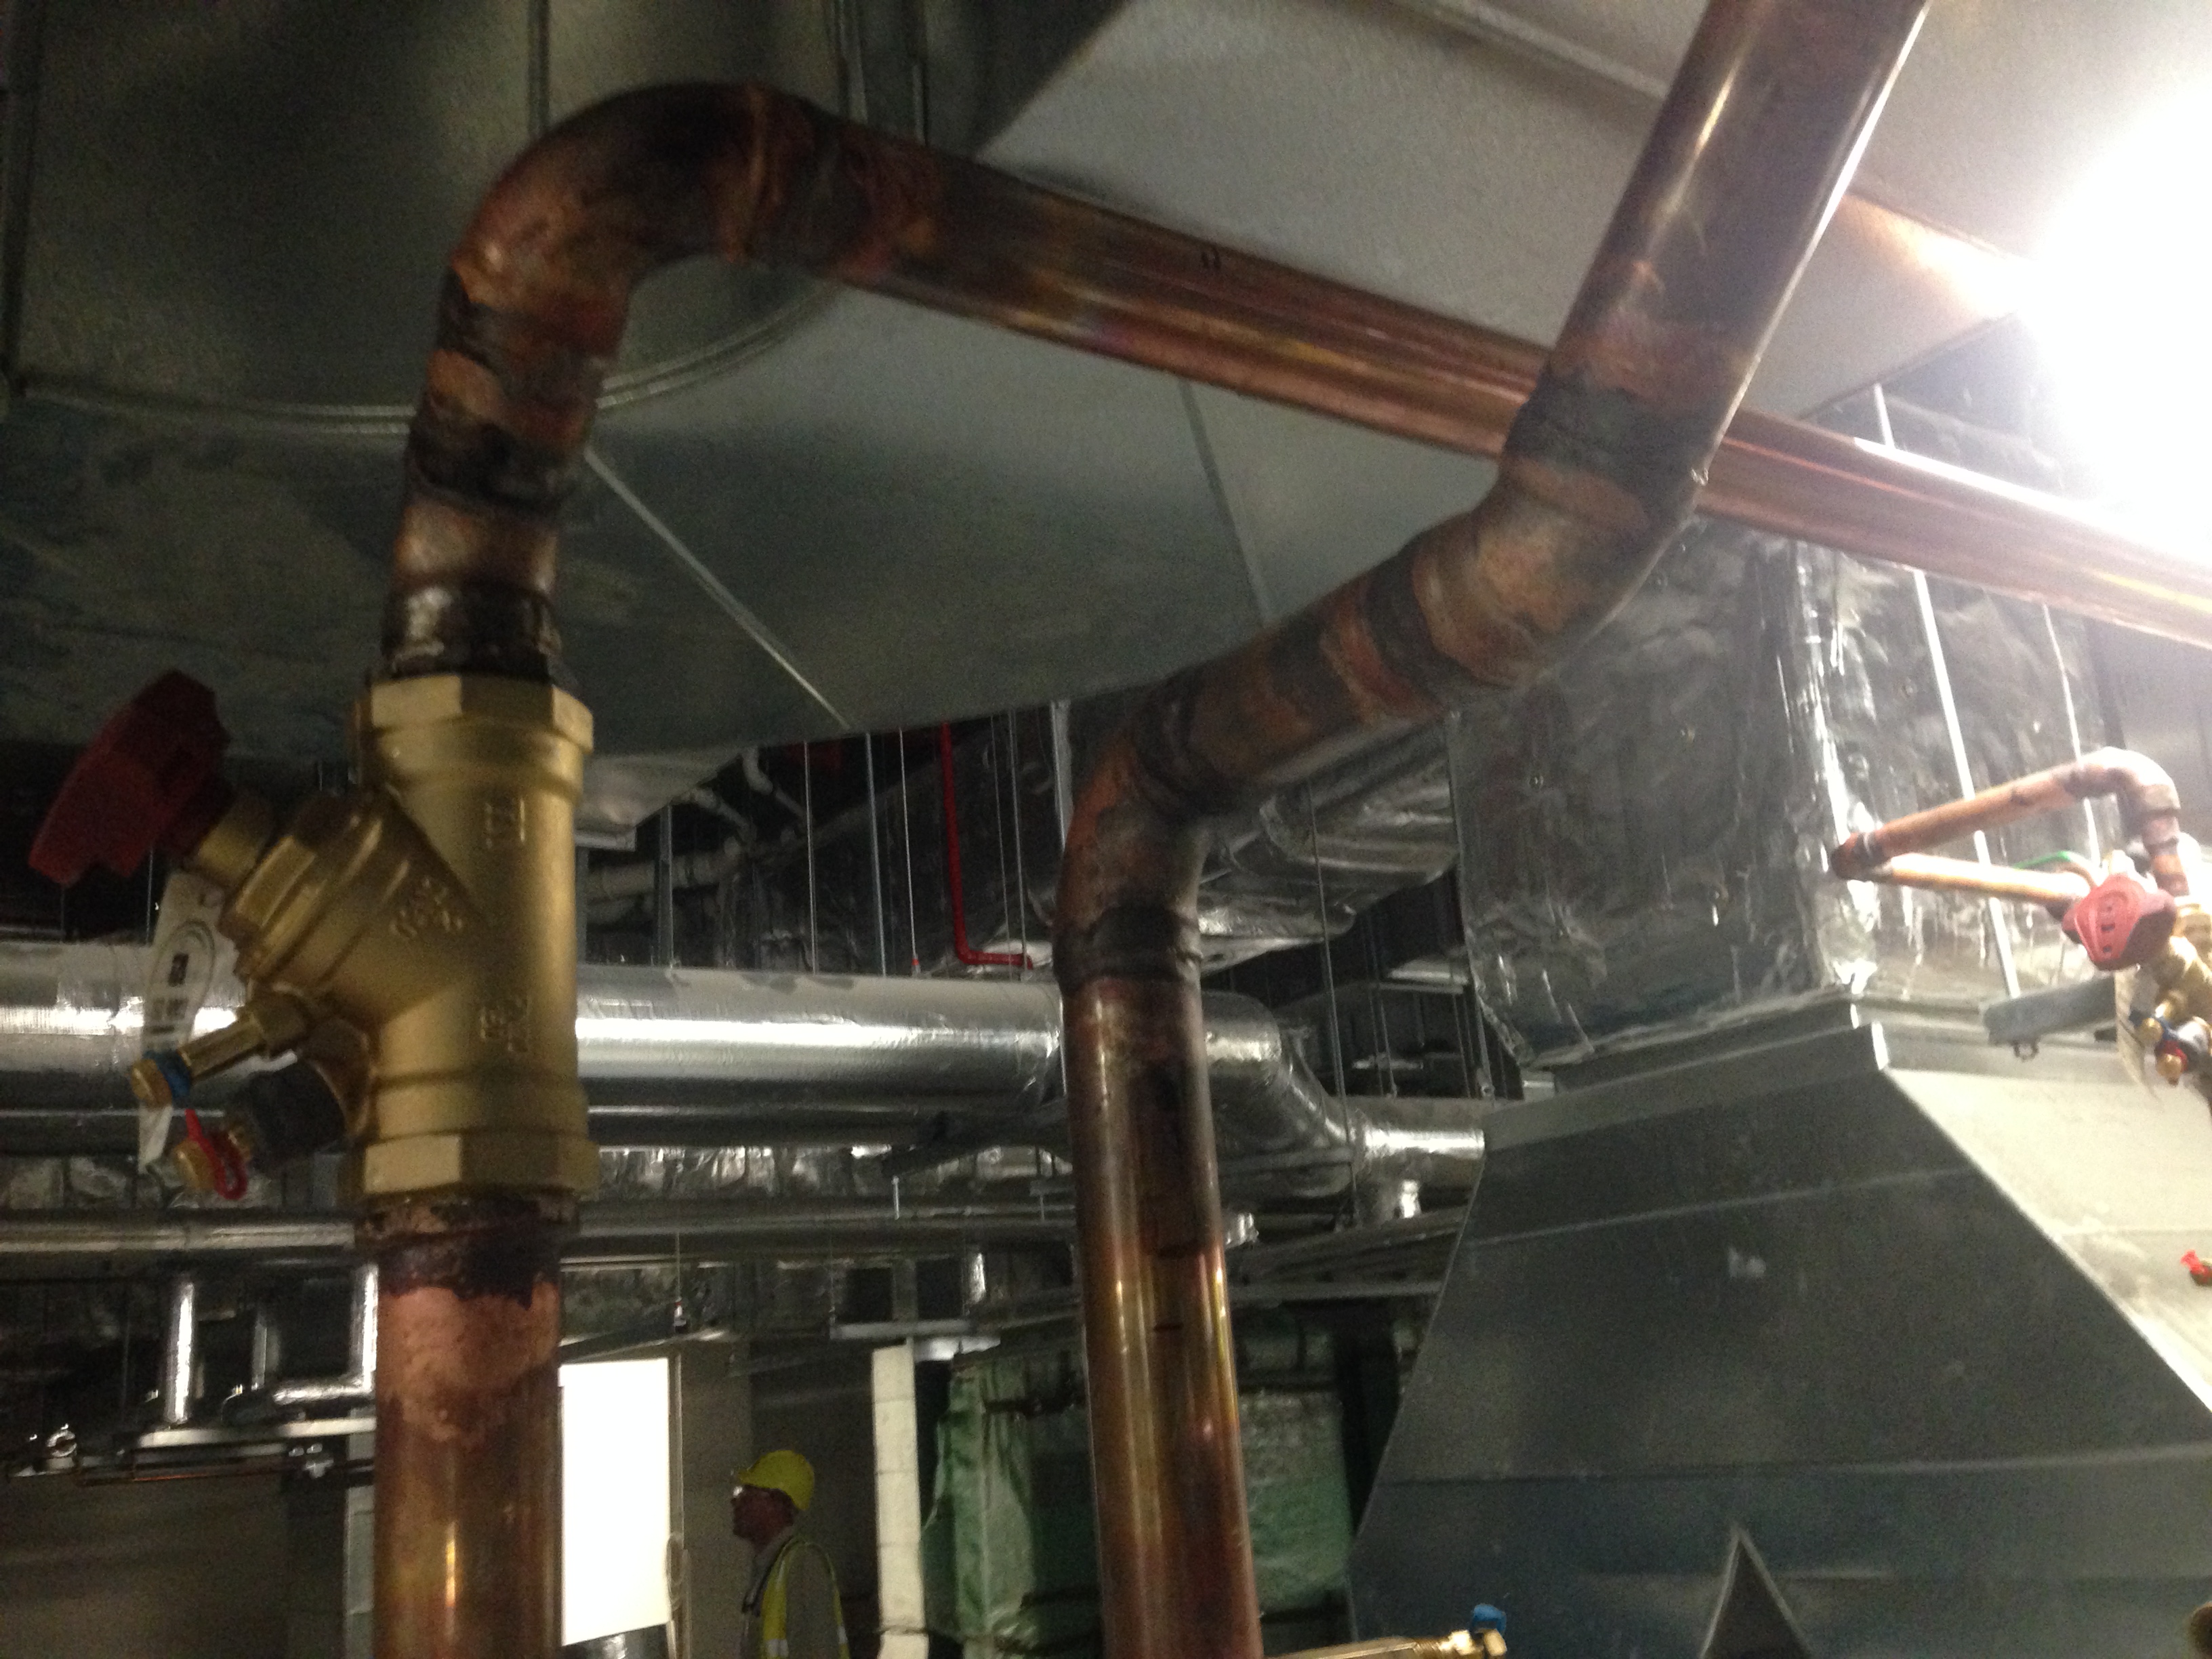
Plant Room 6 Level 4 – flow is south to north. The upstream (south) is within limits (10 x dia) but the downstream (north) should have a straight line pipe section of at least 5 x dia. The valve is 50mm dia = 250mm. Clearly the angle change and then the 90 deg elbow are both inside 250mm so out of limits.
Plant Room 8 Level 2 – flow is right to left. Both upstream (right) and downstream (left) are out of limits. You can see on the right between the lagged fixing and valve that the pipe dia changes from 12.5mm to 20mm. What’s most likely happened here is that they have used the wrong dia valve (pictured is 20mm) for the pipe line of 12.5mm so had to weld in a piece of 20mm pipe to make it fit. Also, just at the edge of the left of the pic the pipe dia changes again – inside the required 5 x dia = 100mm, so out of limits again.
Fredon’s response was that they followed the guidelines as per the Consultant’s Advice Notice (CAN). We pointed out the dims as per CIBSE and TA (the reason we needed to double check TA data sheets) and reiterated that this is what they should be working to not solely the CAN. The CAN is just a notice explaining what work needs to be carried out but must be used in conjunction with documented design data – which they clearly didn’t do.
The Solution
The solution is easy – JHG have rejected the work and rework is required but this time in line with the CIBSE code and NDY Spec.
Commercial Aspects
Fredon will take the hit. There is no recourse as the work is out of scope and has been rejected. A separate notice has been raised to that effect.
Oz – PCH Issues, Issues, Issues…
Week 2/3 and I have now started to get involved… Below are the details thus far of one issue I am getting to grips with – I have another in the back pocket for another blog as I’m conscious they can get lengthy…
BOC and Nilsen Essential Critical Power Supply
Who’s who?
BOC – Medical Gasses Equipment Supplier.
Nilsen – Electrical Sub-contractor.
NDY – Design Consultancy Sub-contracted to JHG.
The Issue
My first real task was to aid in an issue that arose when the BOC sub-contractor tried to ensure power connection to his plant (2 x medical gas compressors and 6 x vacuum pumps) in Plant Room 6 (PR6) to the power supply and found there were no cables fitted. This issue is also mirrored in PR5.
For all plant installation it is the responsibility of the plant manufacturer/sub-contractor to electrically connect back to an isolation point (usually via an isolation box). Nilsen then take responsibility from the isolation point back through busbars, distribution boards etc to the main distribution board and incomer in the basement. The issue was that there weren’t any cables installed and Nilsen’s defence was there were no cables on the design drawing (fair enough). There were no cables on the dwg because NDY didn’t put them in during the design phase (why? Who knows).
The Solution
After an on-site mtg with BOC, Nilsen and JHG (consisting of the block construction manager, my LM and me) we came to the solution that Nilsen would install the necessary cable to a distribution board; the board needing to be roughly equidistant between each piece of plant to ensure a balanced load. This placement required my LM and me to look at the design dwgs and position it on the nearest column structure that also met other factors like accessibility, where the cable runs would go etc. Nilsen also required the load of each installed plant/equipment which consists of; 1 x compressor at 46kW (configured under a N+1 arrangement with the second compressor being stand-by so only one compressor will be powered on at any one time) and 6 x vacuum pumps at 6kW each (5 x duty and 1 x stand-by) giving a total load of 76kW. From this Nilsen can size the cables. NDY and Nilsen’s bigger task was to establish which connection point to the mains was best; either all the way down to the incomer in the basement (4 levels down via the service riser) or; as pointed out by the block construction manager connect into the Critical Essential Supply (CES) bus duct (essentially what a busbar is designed for) which is only one floor away and a number of rooms across but which is a lot closer overall and thus a much cheaper option as there would be a much reduced cable length (cost not yet estimated) not to mention reduced installation time/labour. However, my LM and I were discussing afterwards that actually the cheaper option of connecting direct to the busbar might not necessarily be the correct option. The busbars should always have spare capacity (in terms of load) designed in so as to enable future plant/loads to be added – part of the head contract specification to ensure the design is ‘future proof’. So, by connecting direct to the busbar you will save on time and cost but you reduce the capacity for future flexibility provision both in electrical capacity (designed for 20%) and space(designed for 30%) this is in addition to the contingency provision of 10% capacity and 15% space. The devil will be in the detail as the load required by the BOC plant may be small enough that it won’t add significantly to the busbar – it depends on what percentage of spare capacity we can eat into, bearing in mind it may have been eaten into already. And will the client have an issue with it?
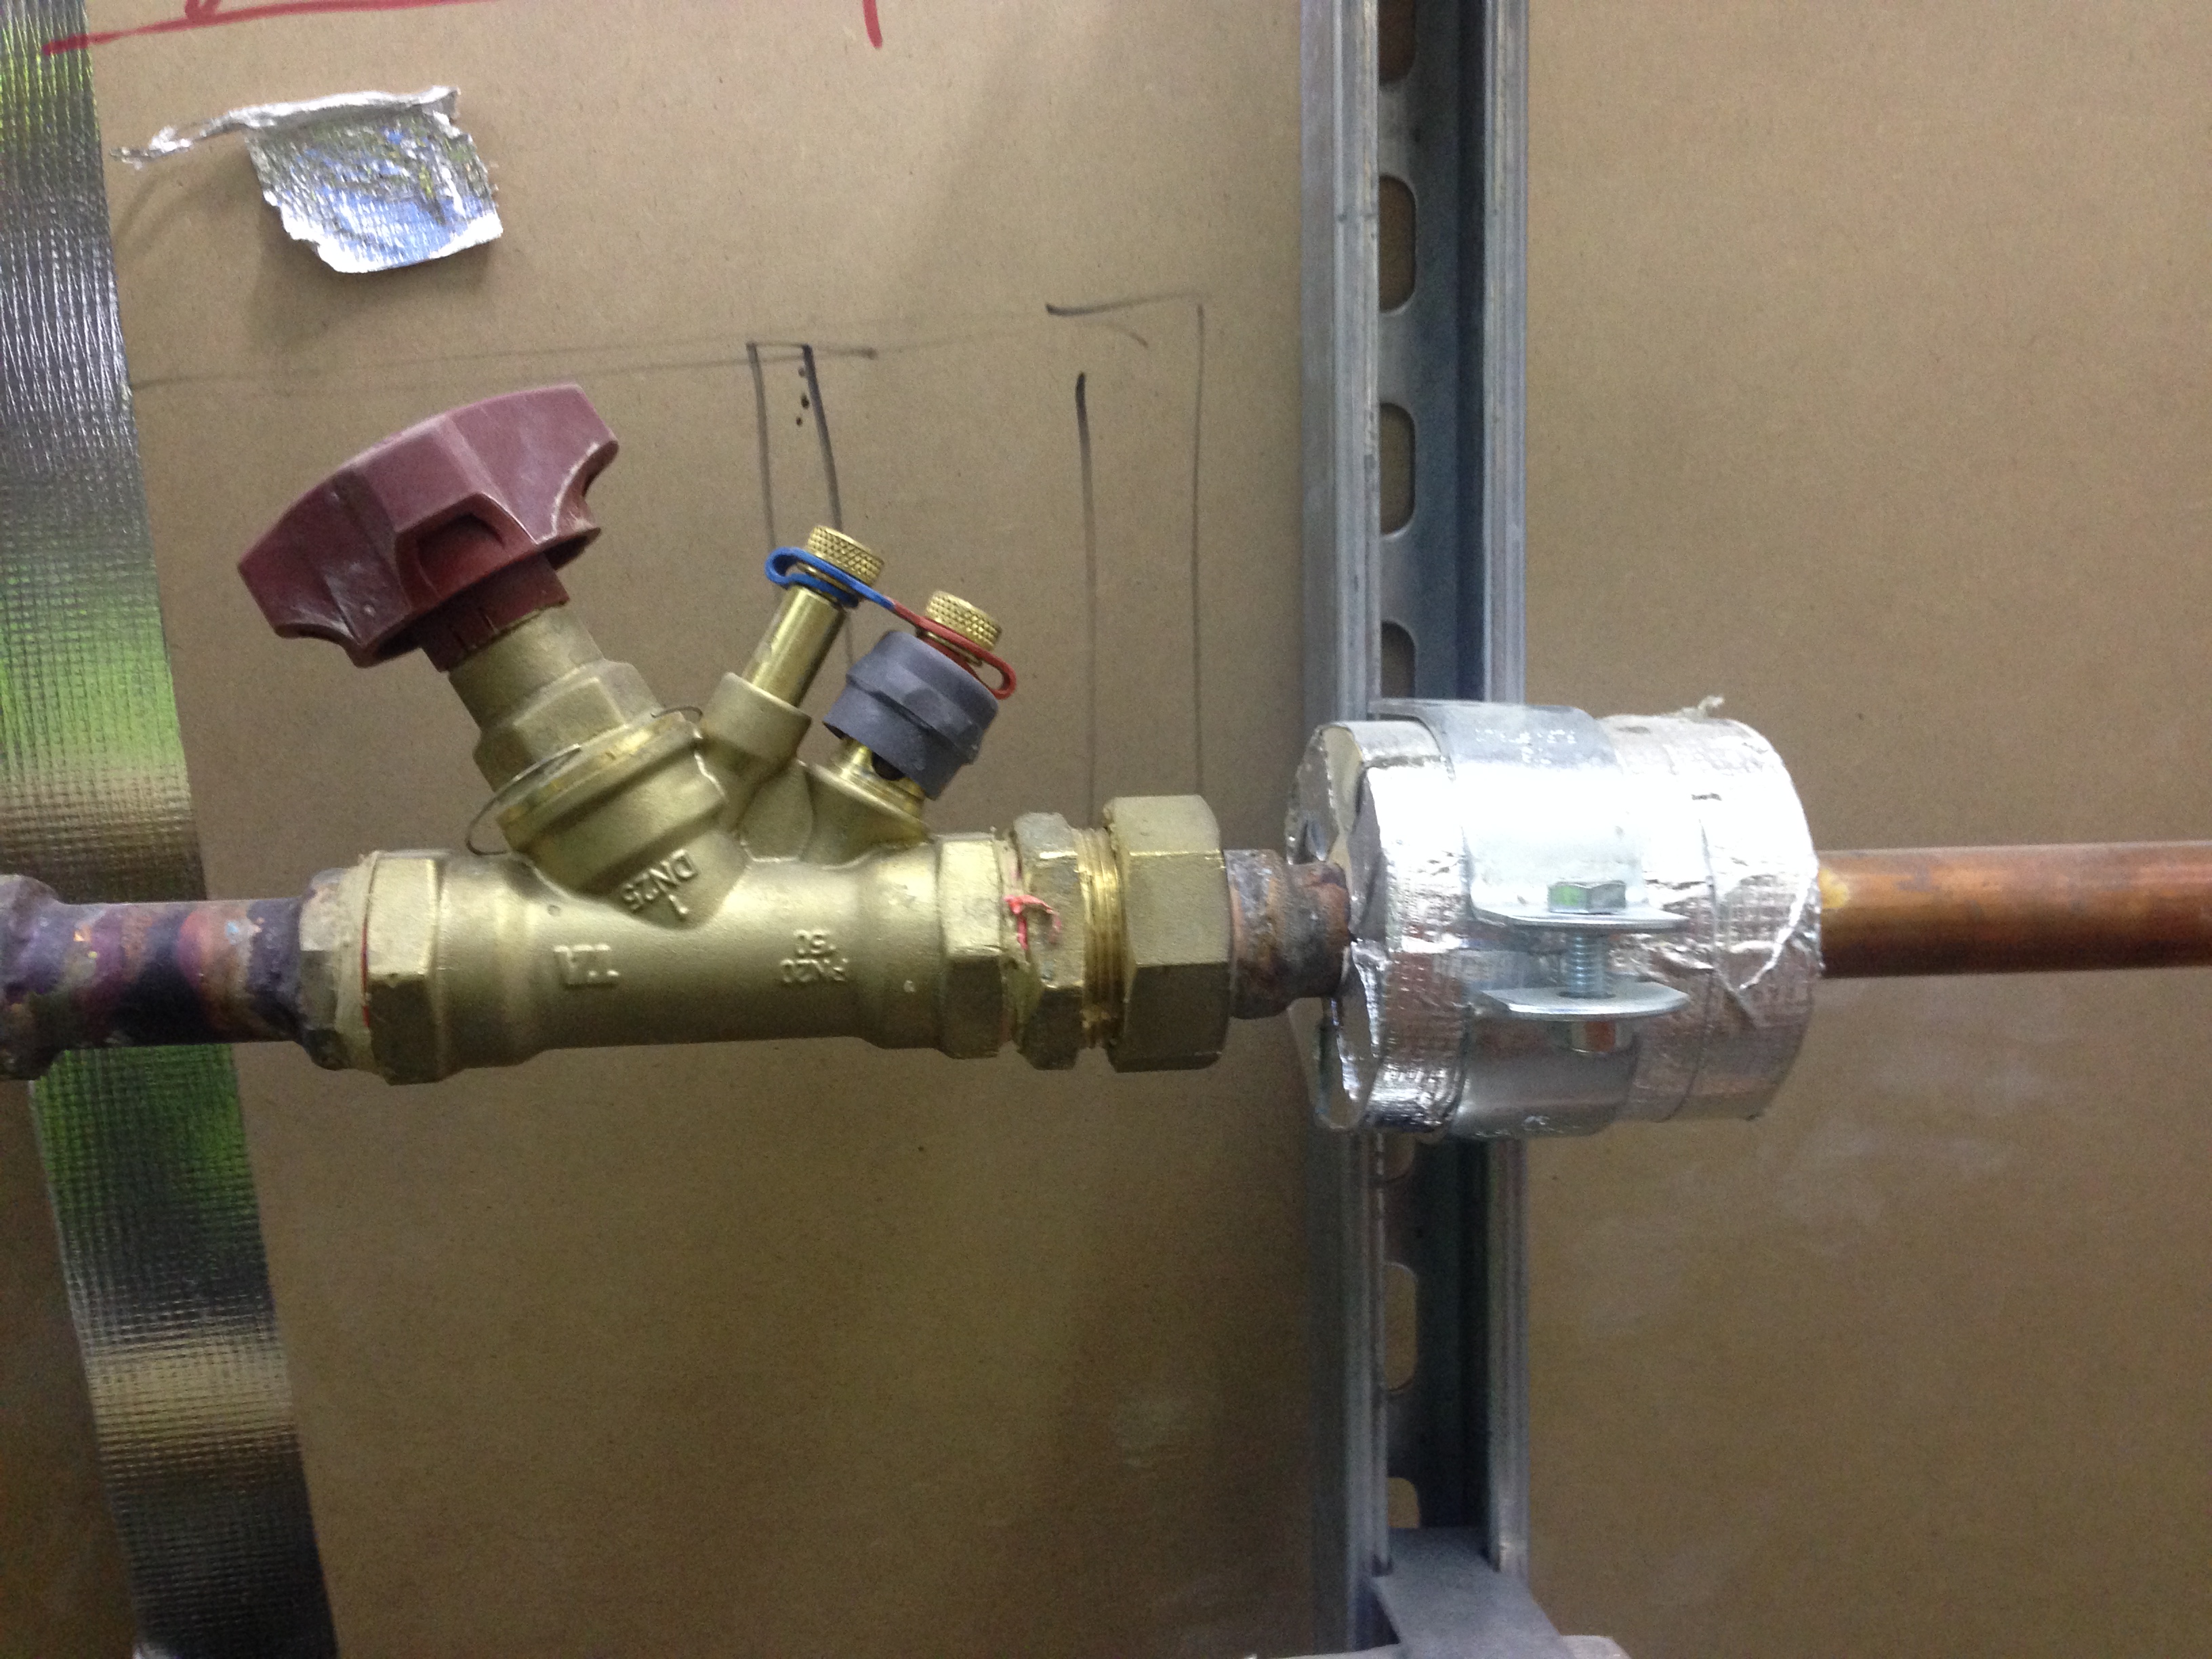
2 x Lento 37 Medical Gas Compressors set-up in an N+1 configuration.
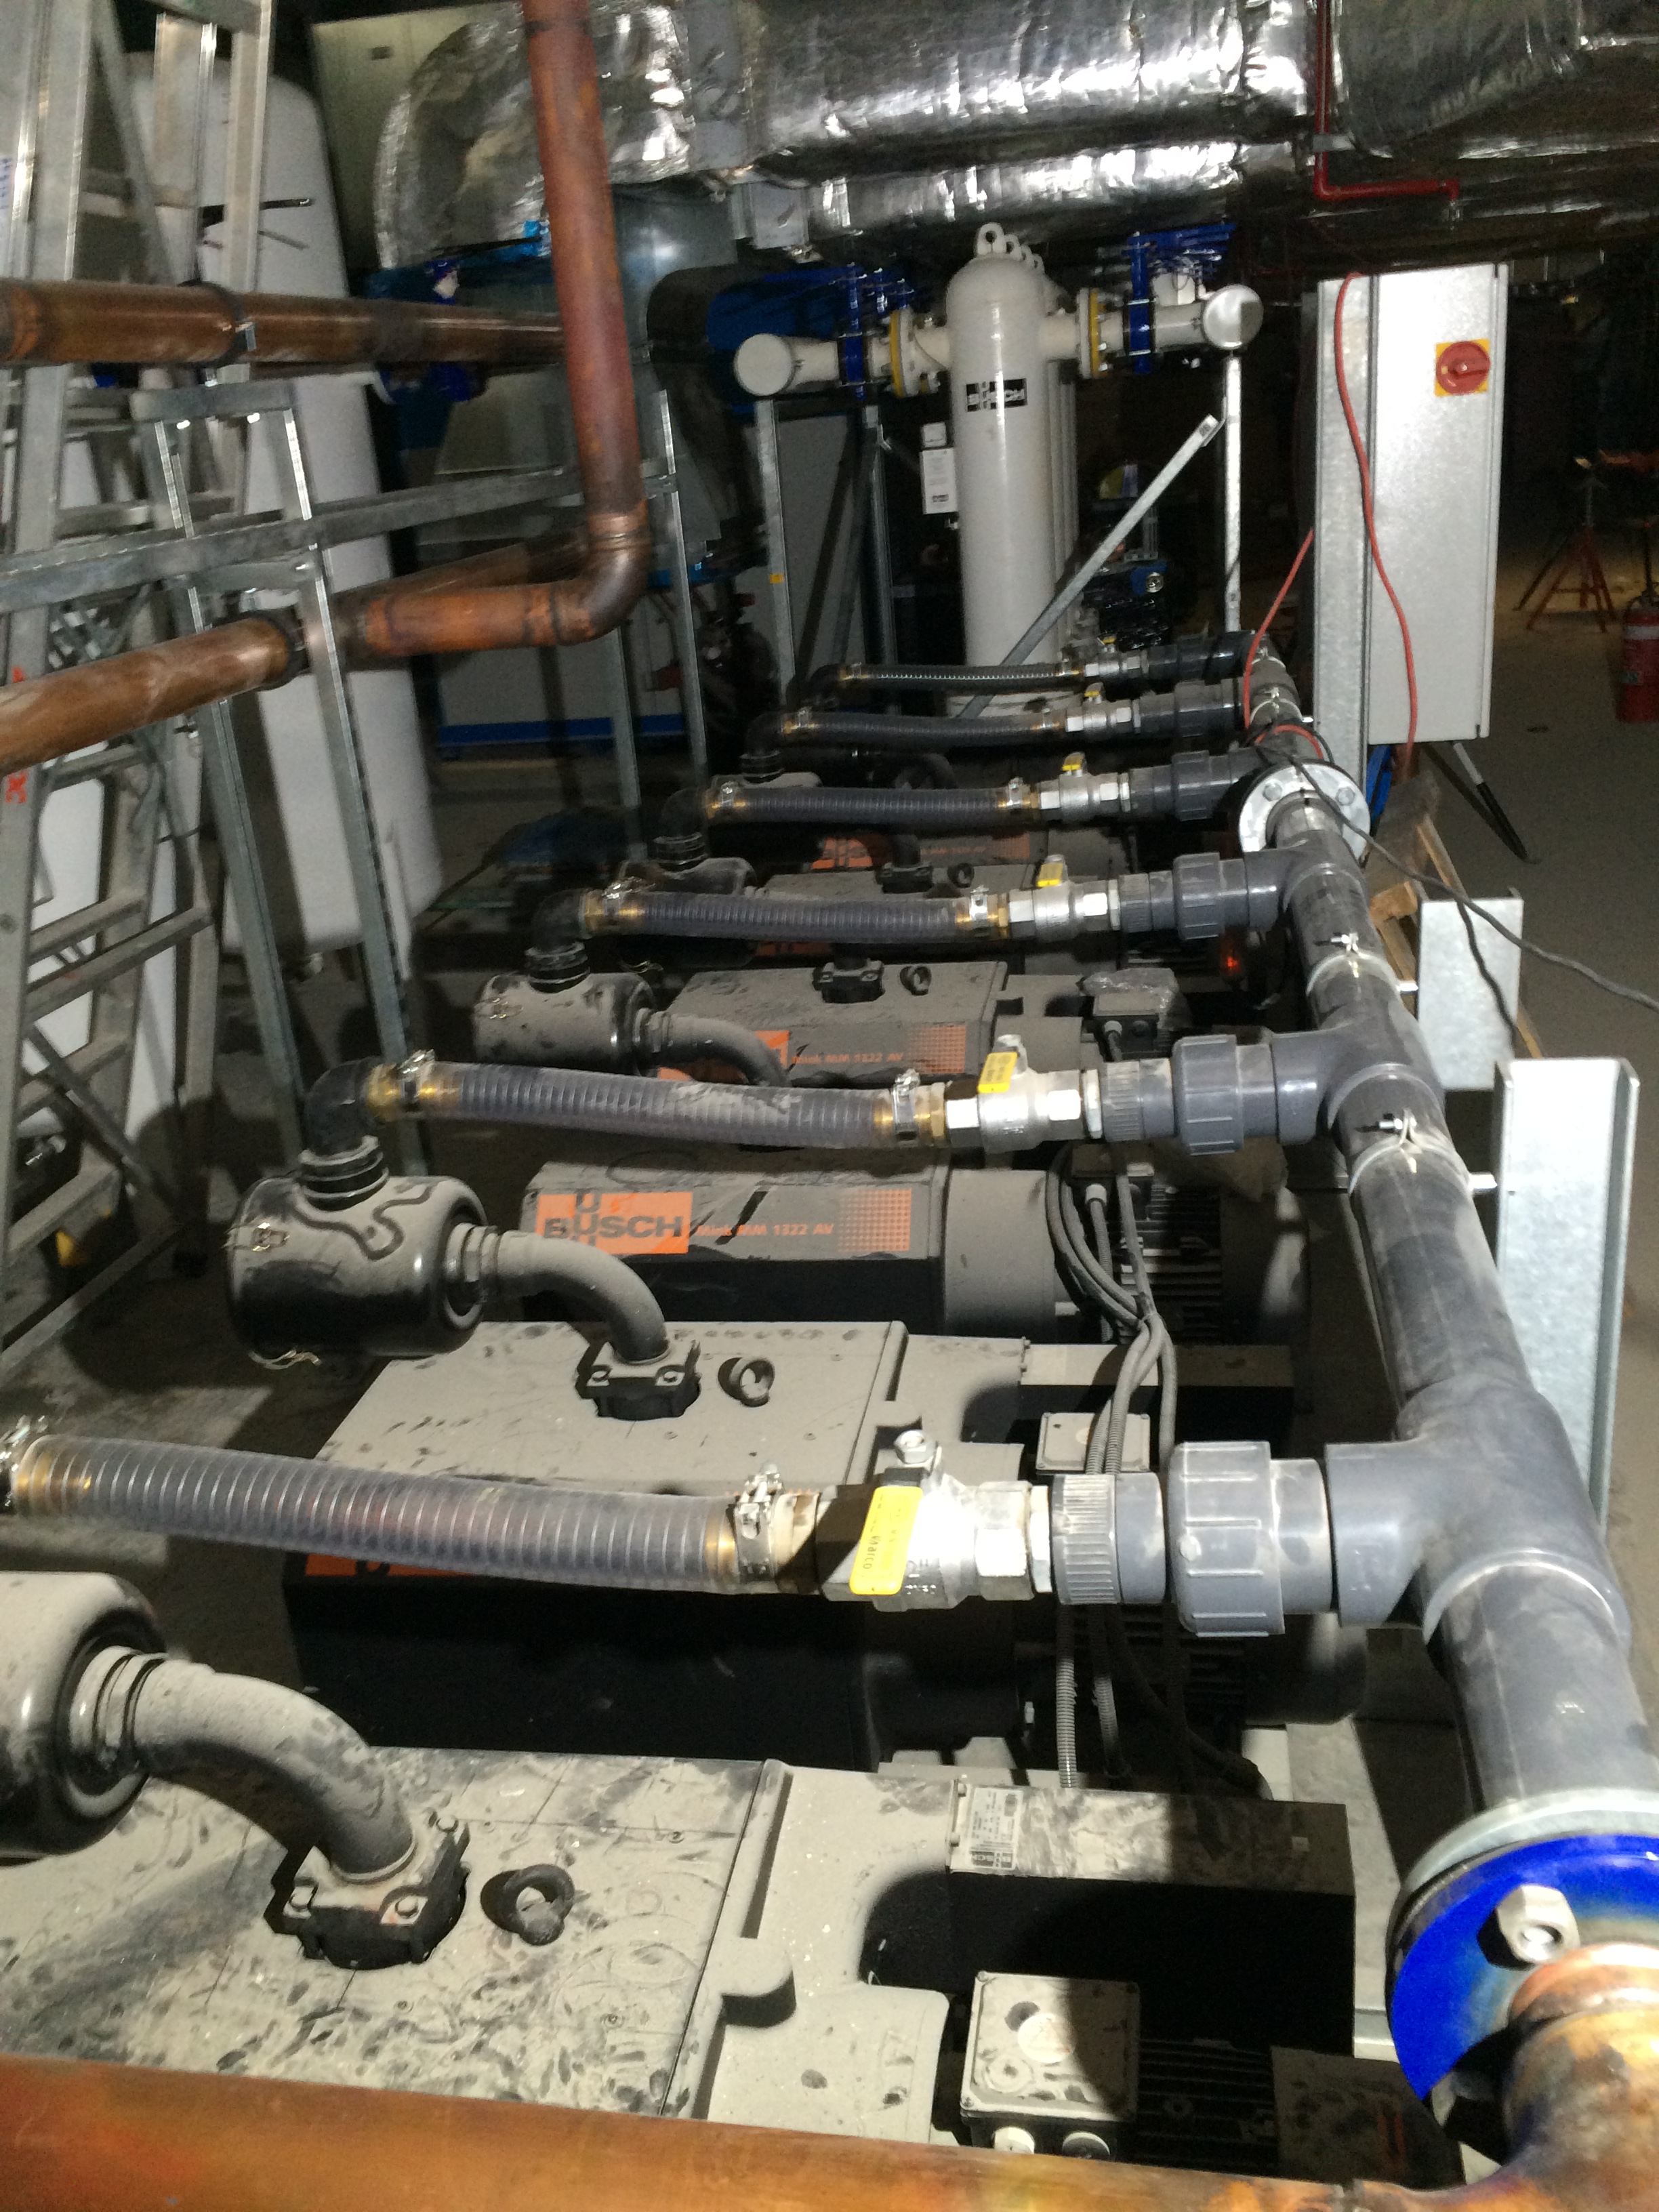
6 x Busch 6kW Vacuum Pumps set-up in an N+1 configuration.
Commercial Aspects
Of course the biggest issue here is who is going to pay for the cable omission? This is where on a project of this size it’s good to be able to off load it onto the commercial team who deal with sub-contracts, late notice payments etc etc all the time….but for me personally this is an opportunity to understand the commercial aspects and help toward ticking off some competencies. Contractually, here are the options (I must add this feels like answering one of Greg’s PCM exam questions): BOC say “we need power to our plant, where is it?” Nilsen say “no cable on the dwg therefore we haven’t installed one” (fair enough). JHG investigate and it turns out that NDY didn’t design it in therefore why it’s not on the dwg. So, quite clearly contractually Nilsen will put an invoice in for doing the works to JHG and JHG slap a design variation order on NDY. Cut and dry right? Well no, because NDY are a consultancy and they don’t have pots of cash lying around to dip into for mistakes like this, what they do have though is their liability insurance. The issue here is it costs (in this case JHG) money to reclaim costs against a consultant’s liability insurance – somewhere JHG doesn’t particularly want to go. So where does that leave us? JHG will have little choice but to instruct Nilsen to carry out the works and when the variation payment request from Nilsen comes in pass it over to the Contracts Administrators to investigate how to handle it. The bill will be in the order of $250k, hence the block construction manager highlighting a possible cheaper solution.
Nilsen are on a Guaranteed Maximum Price (GMP) contract, essentially they priced the entire works at the tender stage and should have a substantial ‘risk pot’ to cover these design issues but generally JHG will reject any Variation Order (VO) from subcontractors under a GMP contract. So JHG can turn to them and say “this is in your scope of works so we’re not paying twice for it”. However, JHG have rejected a vast number of VOs from Nilsen already to the point where another rejection (especially of this cost) could cause relationship issues and push Nilsen to rethink further business with JHG. The political point to add is that Nilsen are one of the best electrical subcontractors in WA and that is something JHG have to factor in. So the CA may have to come up with some form of compromise and when the total VO costs come in there may be some horse trading to be had. This is going to be a commercial contracts issue that is initiated by me raising a Subcontractor Direction – Authorisation Request (due to the commercial risk) which is then sent to the CAs and added to the overarching risk register.
An update whilst compiling this blog came through with the Project Director issuing NDY with a VO notice to pay for the entire variation and we are now awaiting NDY’s decision – potentially this is heading to the courtroom! This has been a good learning experience to investigate the ‘what ifs’ regarding contractual relationships and I will follow this through with the commercial team to see how it pans out and fall a little deeper into the bottomless pit that is contractual issues.
So what?
Aside from this issue on the whole JHG will try and steer any possible VOs away from a subcontractor under a Lump Sum (LS) fixed price contract and onto a subcontractor under a GMP contract as they know they can reject any possible variation claim. This only really occurs when the issue is at a physical point in space between two or more subcontractor’s remit of works and JHG can wangle it so the subcontractor under a GMP contract has to rectify the issue – thus knowing they are highly unlikely to win a claim for the variation. A basic example being ductwork (to be installed by subcontractor A – GMP) which will clash with water pipework (to be installed by subcontractor B – LS). If it is proved the positioning of both services are correct, as per the design dwg, JHG will try and make subcontractor A change their design.
