Archive
Site Two Fifty One – Concrete strength and Waterproofing
Site Two Fifty One – Concrete strength and Waterproofing
A set of cubes for each capping beam pour is taken. BS EN 206 states that any individual 28 day result should be no less than characteristic strength- 4N/mm² and a rolling set of 3 should have a mean less than characteristic strength+ 4N/mm². This means 46N/mm² or 54N/mm². Recent results put it near to the 54 N/mm² limit.
However, after some discussion, the aim now is to use the 56 day results to confirm compliance.
The capping beam cube results have also come back with the piling concrete results. Their mix uses a 50:50 proportion of Portland cement to Ground Granulated Blastfurnace Slag which brings a faster strength gain up to 28 days compared to my mix of a higher (70%) GGBS quantity.
Between 28 days and 56 days there should be more strength gain of the higher GGBS proportion concrete. Although the 56 day strength of the 70% GGBS will be lower overall, there is more gain of strength later on, than that of the Portland cement: GGBS 50:50 mix.
More eloquently:
“Typically a CEM I concrete will achieve about 75% of its 28-day strength at seven days, with a small increase of 5–10% between 28 and 90 days.
At 70% GGBS, the seven-day strength would be typically around 40–50% of the 28-day strength, with a continued strength gain of 15–30% from 28 to 90 days.”
Reference: Cementitious Materials – The effect of GGBS, fly ash, silica fume and limestone fines on the properties of concrete.
So what and who cares?
Faster strength gains (found with higher Portland cement content) = higher heat of hydration = more likelihood of cracking in deeper members. Therefore reducing cement to GGBS content, as long as the eventual strength is of that required (50N/mm² in my case), helps reduce cracking. Who cares? – People who construct below the watertable – me and my project!
Waterproofing
Reflecting on Guz’s comments on the cost of injection grouting cracks to improve the waterproofness of concrete, I am at the pre-pour stage.
We are using a hydrophilic (absorbs water over time) material to form a watertight joint between the top of the piles and the base of the capping beam.
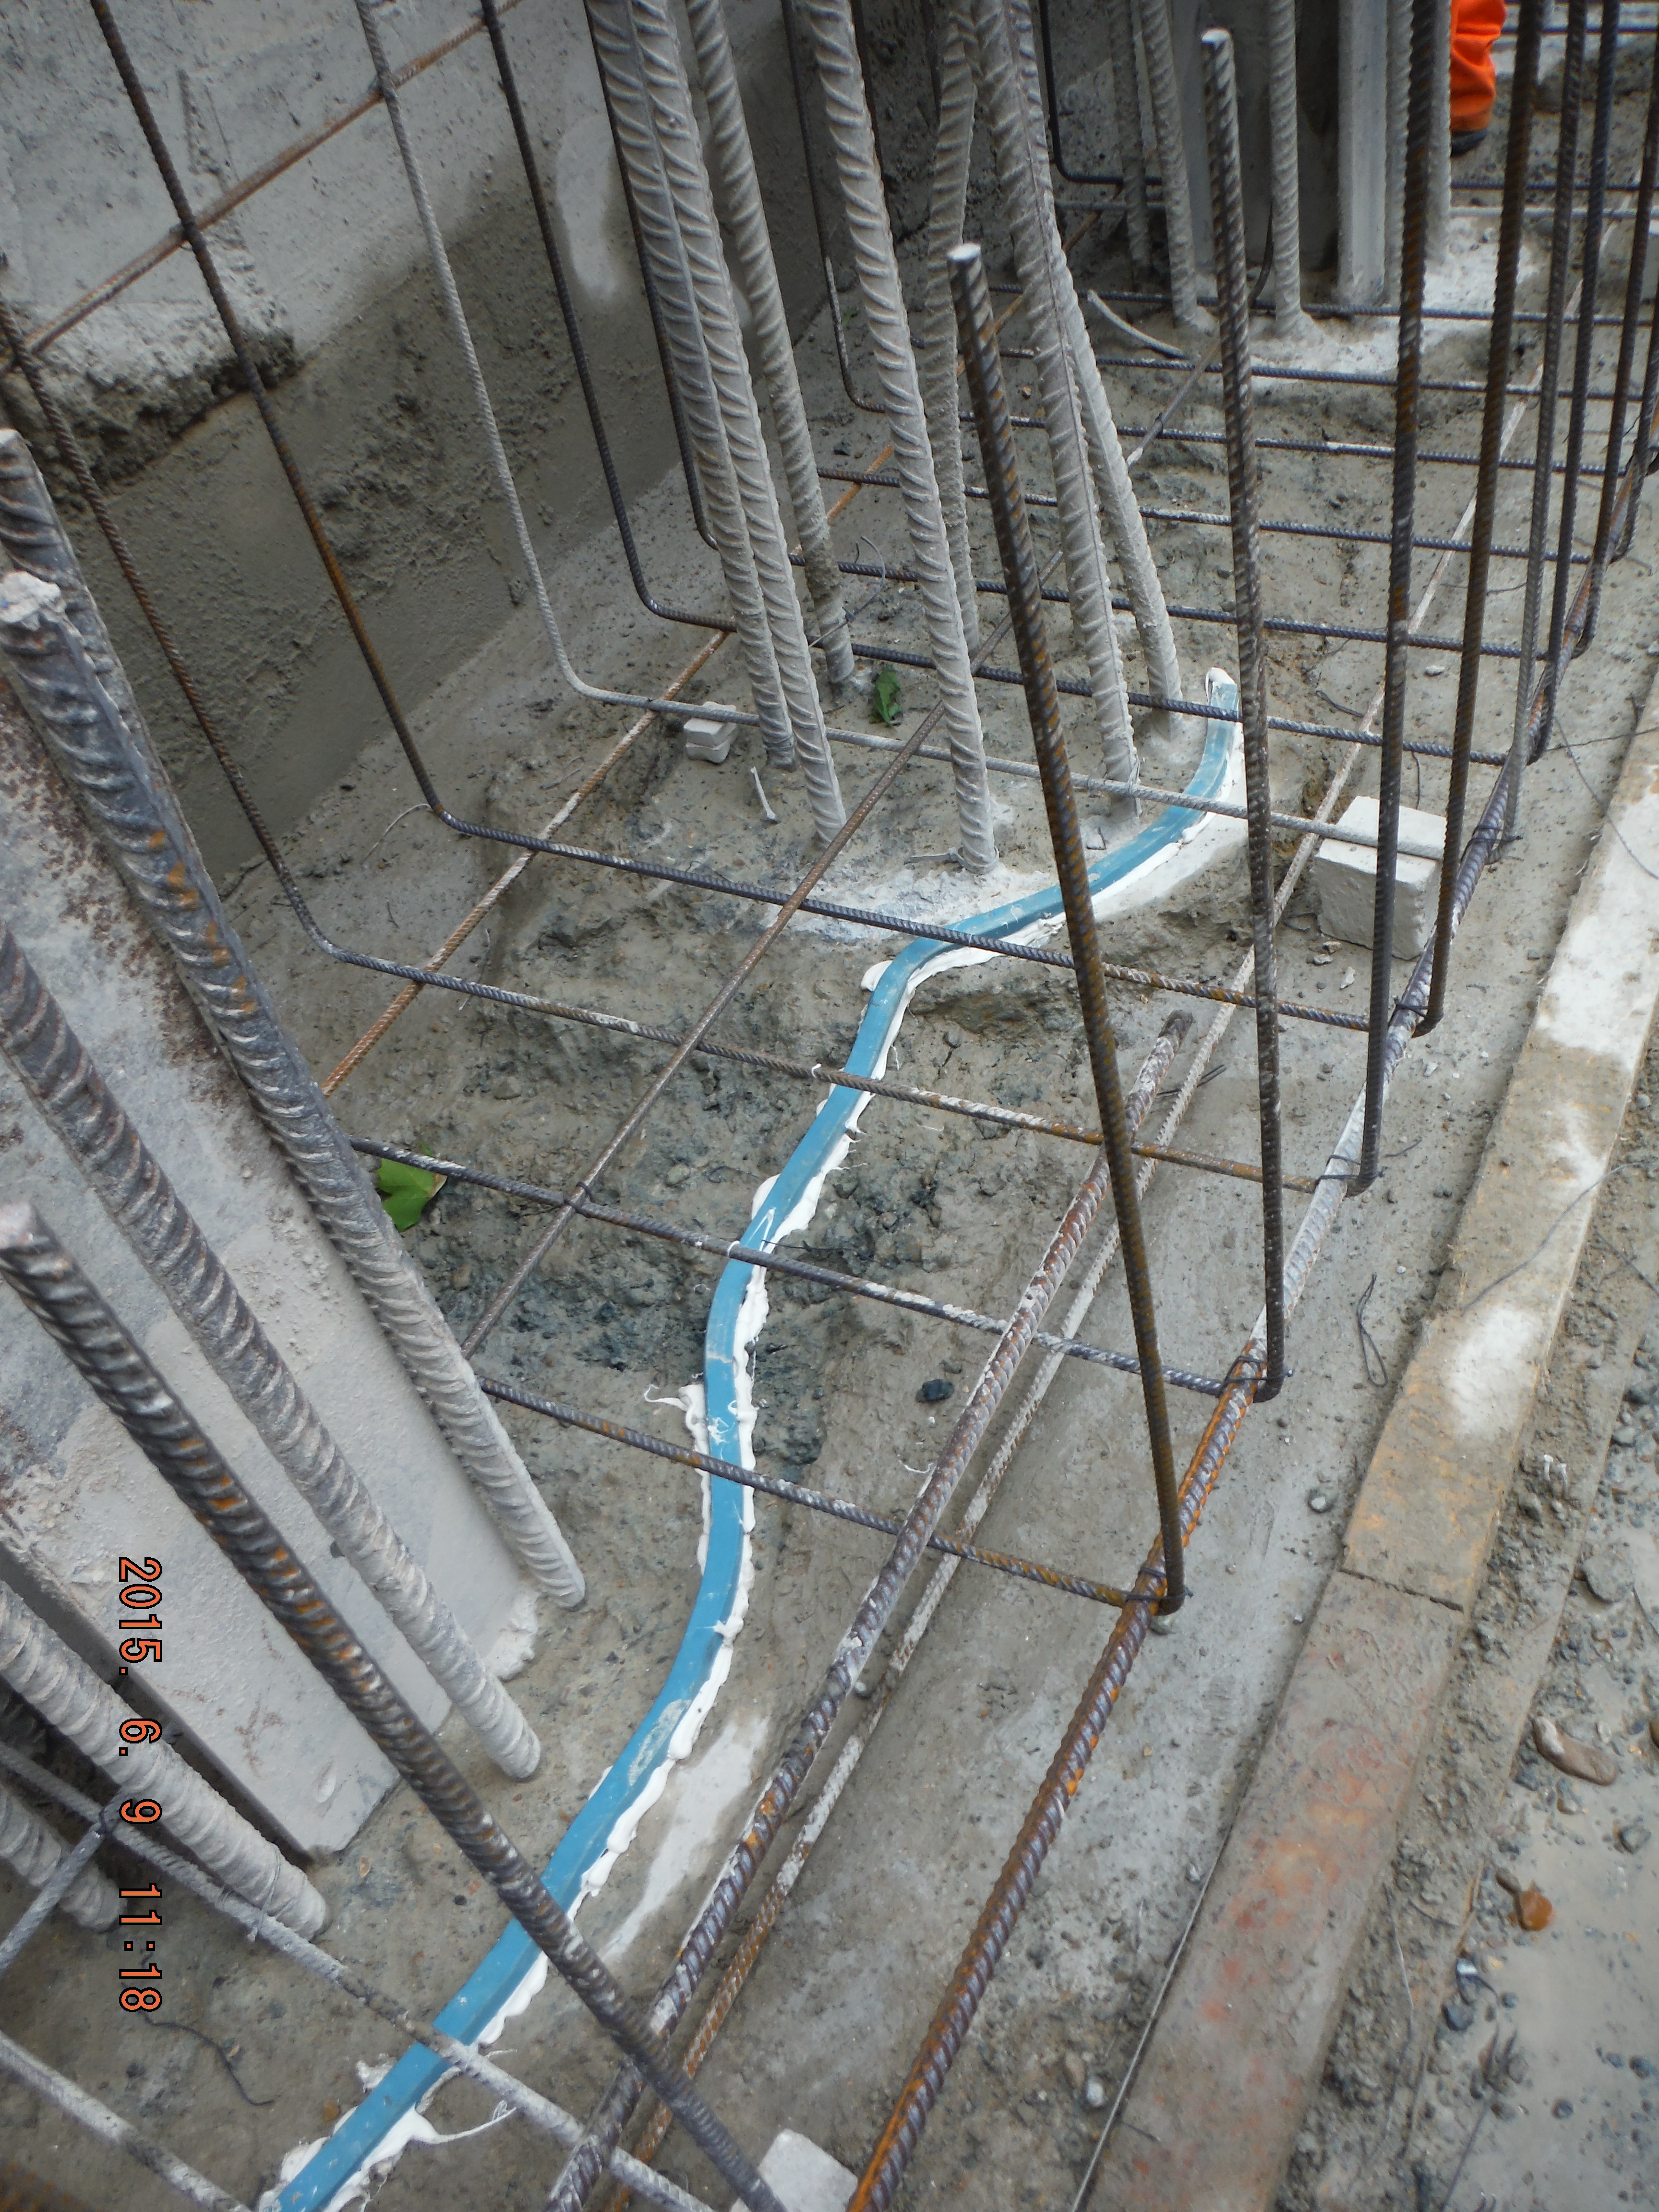
Hydrophilic strip laid along length of secant piles within “waterproof” section.
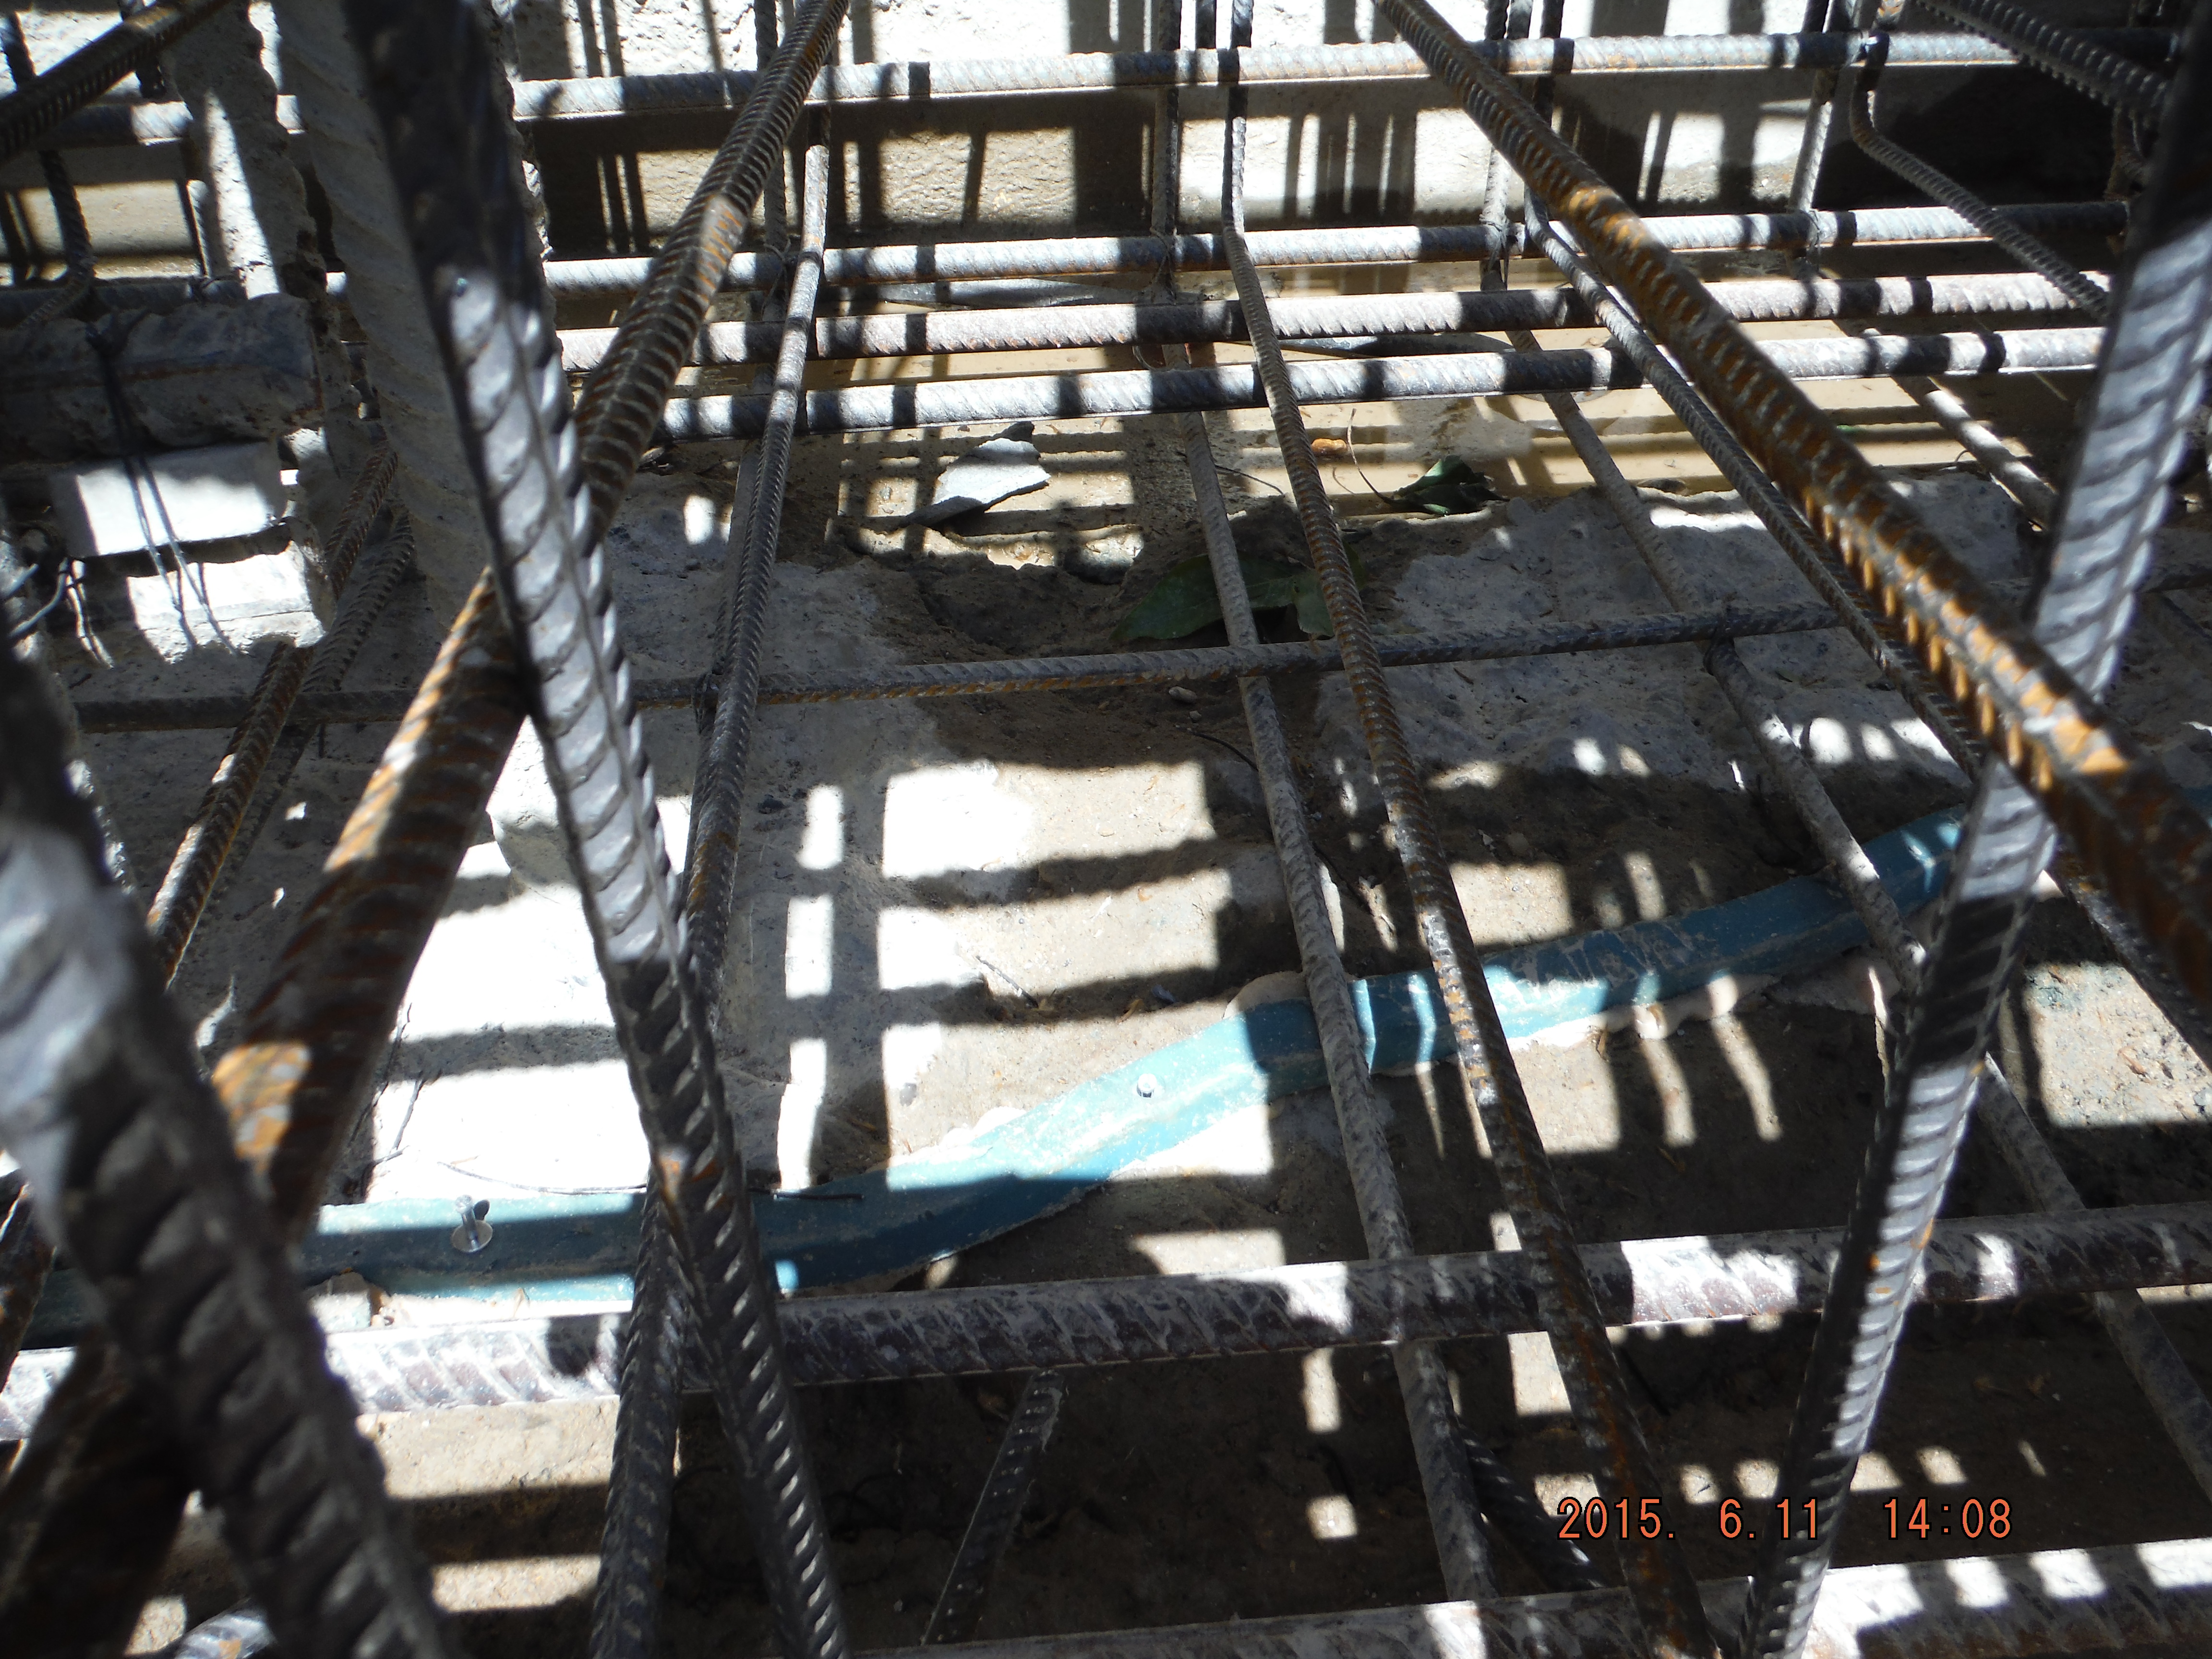
Line of hydrophilic strip.
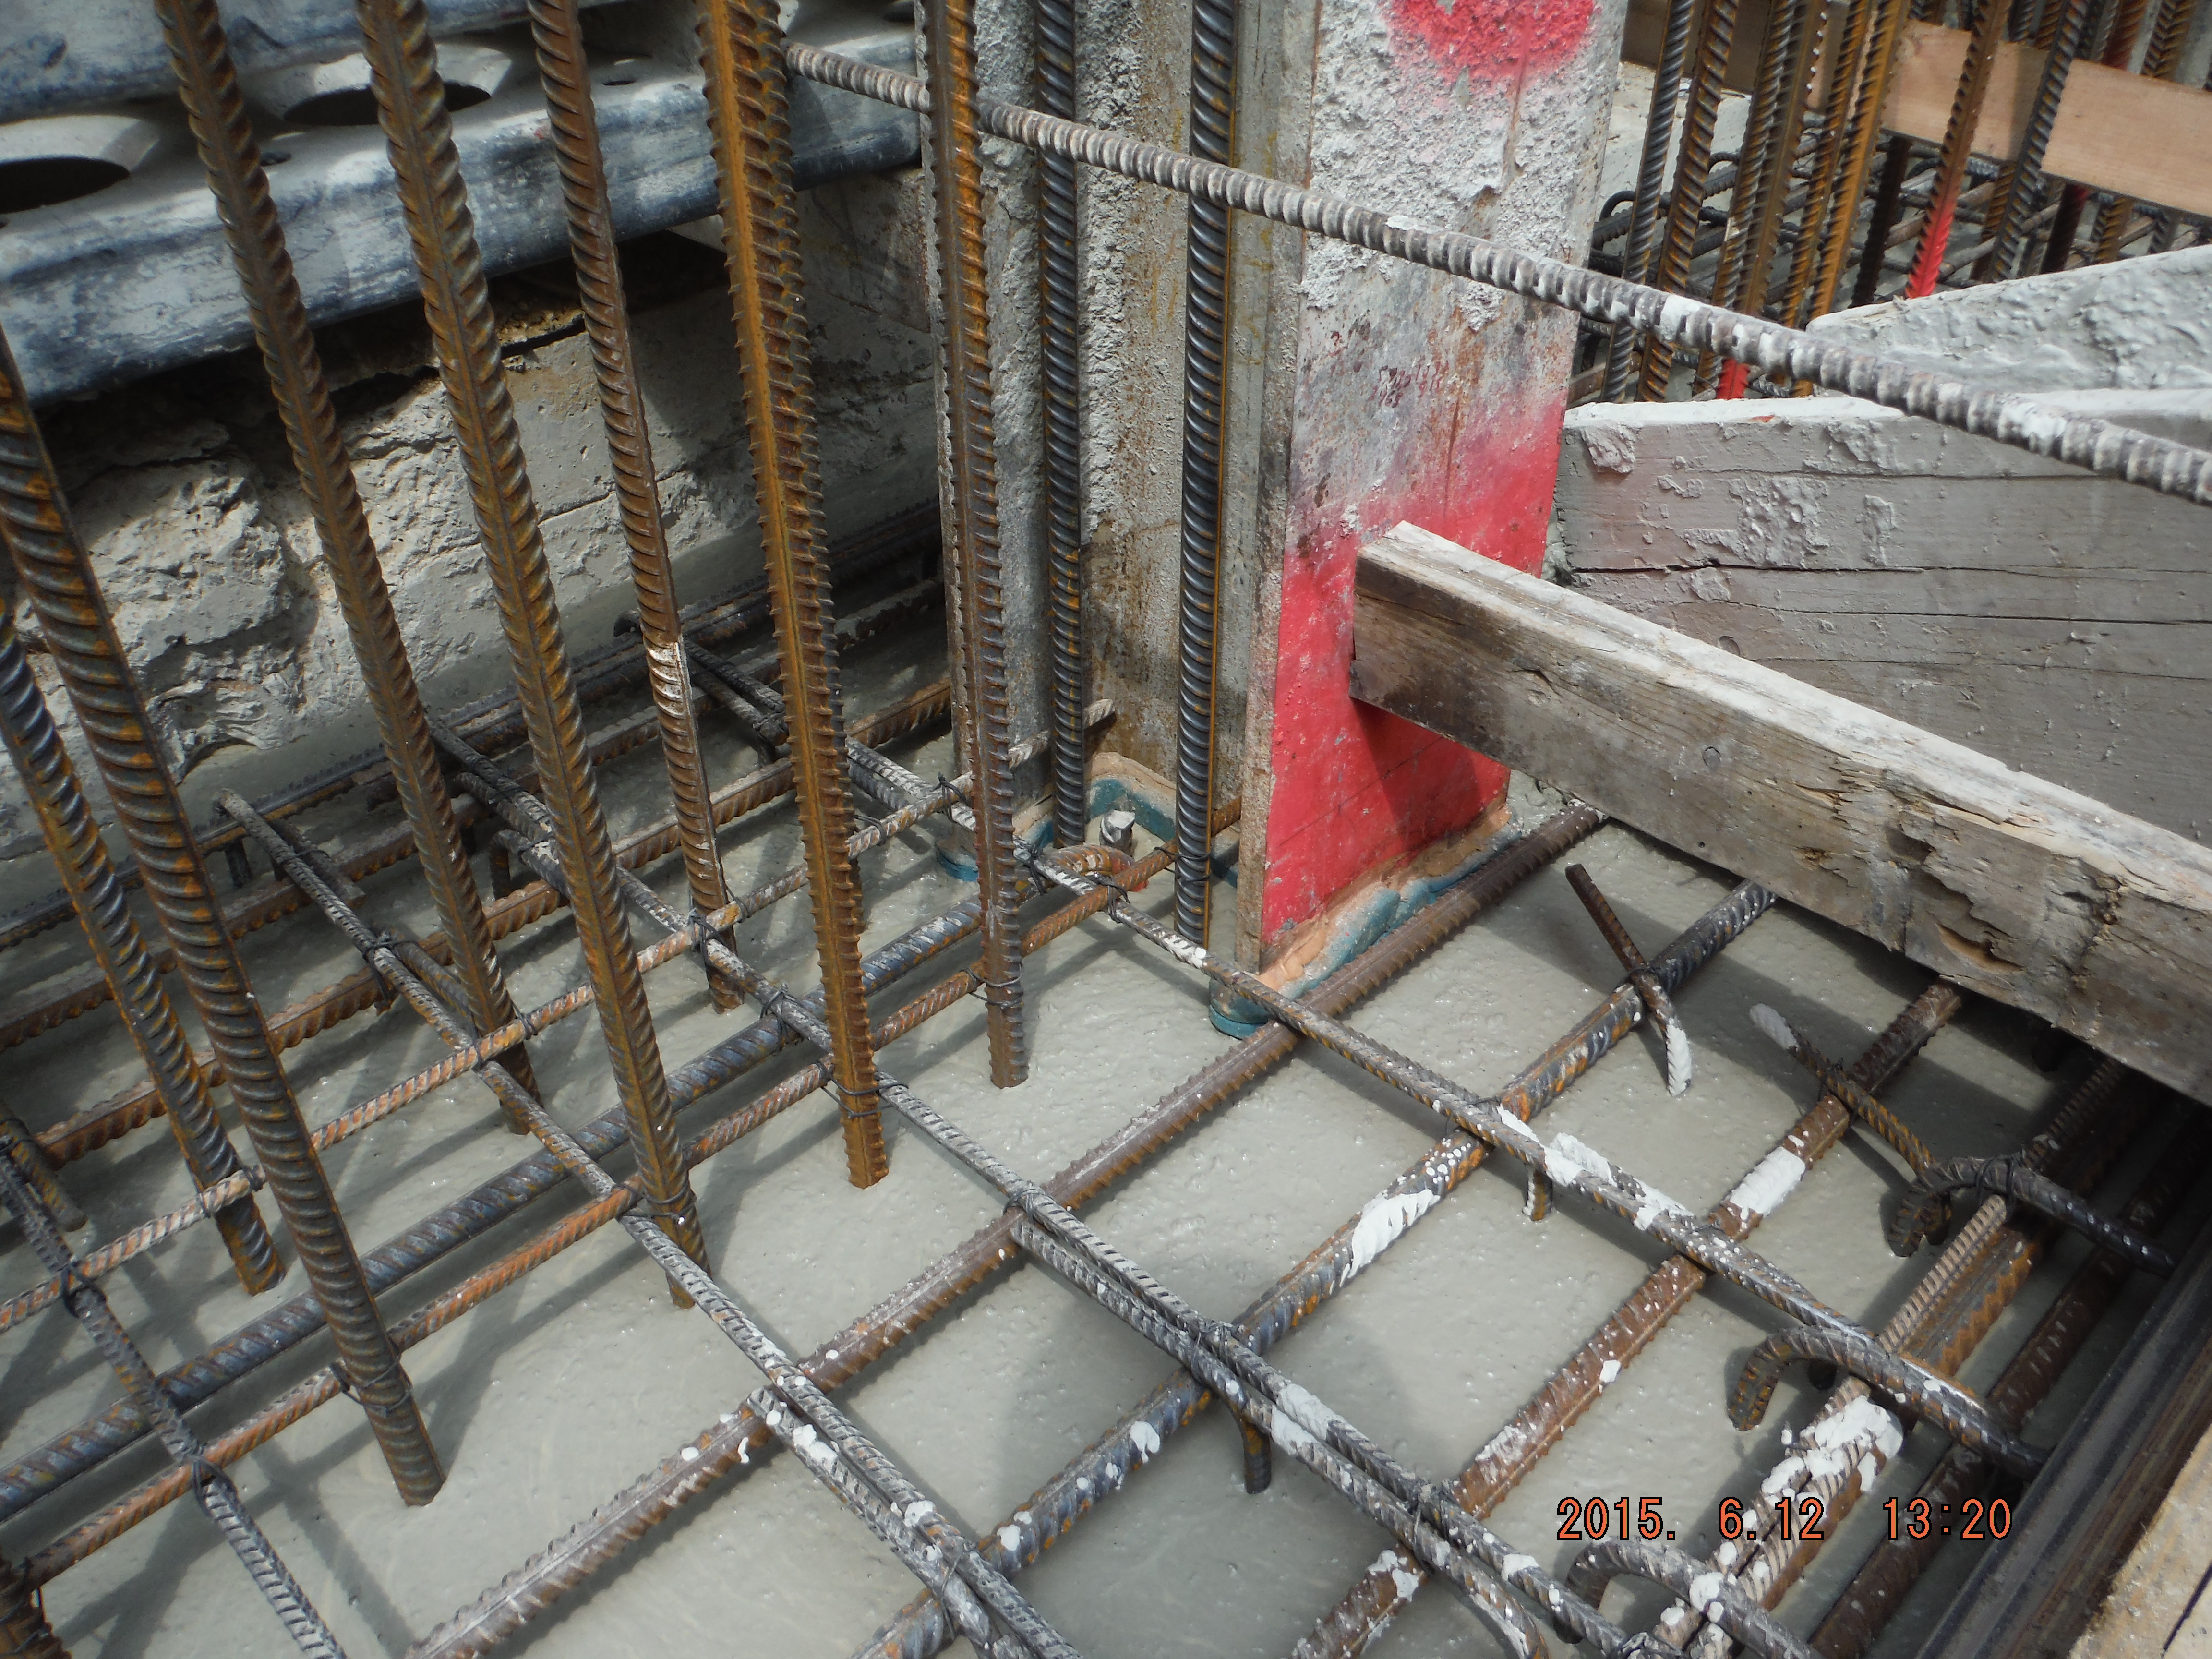
Hydrophilic strip fastened around king posts.
Thoughts.
The advantage of this system is that the joint between the surface of the piles and the bottom of the capping beam will not provide a path for water to pass along.
However, there are fairly significant reality issues with this.
- The piles have been broken to cut off level using breakers – therefore the surface is overly rough and uneven (beyond the mechanical interlock required for a structural joint).
- In the instance of an uneven surface a mastic beading is to be used to sit the hydrophilic strip onto. This is then supposed to be nailed to the piles. Issues here are using masonry nails has safety issues – they fly out and hit people, the nails also provide a water path.
- The reinforcement cage needs to be installed after the hydrophilic strip has been laid. Therefore during the installation of the cage great care has to be taken to avoid standing on the strip.
Waterproof concrete
Finally, and I will only touch on this, we are using waterproof concrete to ensure water does not pass through the capping beam in certain areas. The Grace (company supplying waterproof admixture) datasheet provides a comparison of permeability of the control concrete compared to the waterproof concrete as follows:
Control: 6.90 x 10⁻¹⁴ ms–1
Waterproof: 1.28 x 10⁻¹⁴ ms–1
This translates that in 10,000 years the waterproof concrete might have water penetration of 4mm compared to control concrete of 21mm. Last time I checked, design life of buildings was somewhat less. When identifying risks – this (concrete permeability) is not one of them.
Conclusion
More important are the joint preparation, crack control – through mix design and curing methods and vibration to reduce porosity.

Capping Beam concrete pour with waterproof concrete.
Lessons learnt
Introduction
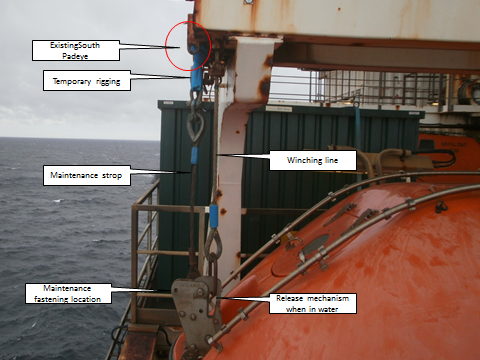
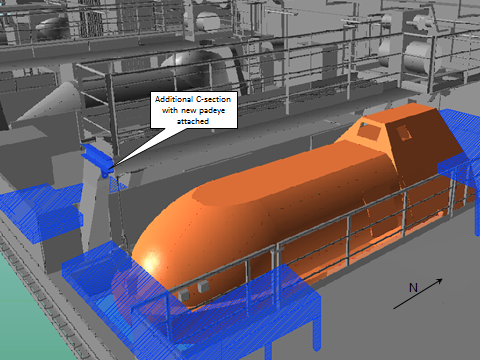
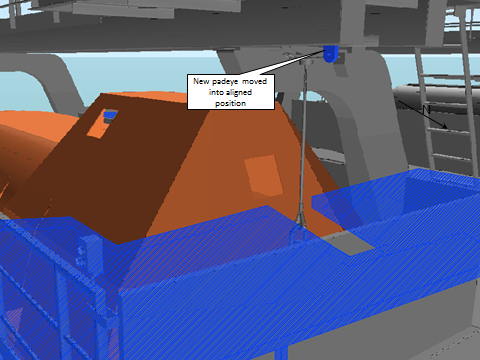
A few years ago a number of lifeboats were upgraded to take into account the increased size of the modern platform worker, which resulted in slightly longer lifeboats. The lifeboats are permanently suspended by the winch lines but require additional pendants and padeyes to temporarily hold the lifeboat when maintenance is carried out on the winching gear. Due to the increased weight and the misalignment of the padeye and maintenance fastening location (due to increased length) it was identified that new padeyes would be required.
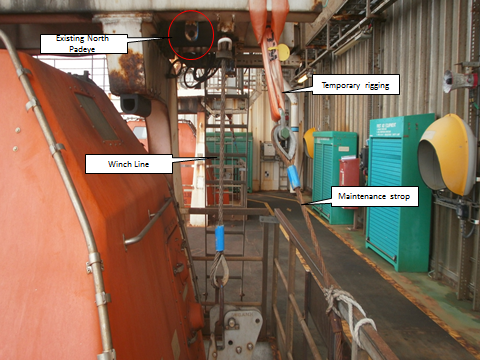
Solution
Quite simply, cut and grind existing padeyes off and weld on new padeyes in adjusted locations. A fairly straight forward job? Nothing is ever that straight forward in an offshore industry!
Who’s who
WGPSN – Engineering Service Provider who are contracted to deliver the project
CAPE – Scaffolding contractors
Sparrow – Lifting contractors
Lloyds Register – Independent Verification Body
Issues
Following a constructability review the following key points were identified.
- Confirmation of the test load for each of the padeyes.
Non-destructive Testing (NDT) is carried out on all padeyes to ensure they are fit for purpose, the question is how much do you test them? Going into the meeting the plan was for a test load of 8.5Te on each padeye, which accounts for a lifeboat tare weight of 4685Kg, 10 pax at 98Kg each and a Safety Factor of 1.5. The gentlemen from Lloyds, who act as an independent verification body, questioned how these figure came about and it could be easy to understand why they would ask that. The tare weight is 4685Kg but is held by two anchor points, so why not half? During maintenance you would only expect 3 pax to be involved so why 10? The industry standard for a safety factor is 2.2 or 2.5 depending on the application, so why 1.5? All very good points and the answer was simple. That is what Lloyds agreed to (told us) at the last constructability review. Unfortunately the individual who told us that was not at this meeting due to being on holiday, so nothing could be agreed there and then.
- Serviceability of the Lifeboat during the offshore execute phase.
Removing the lifeboat from service would impact the number of pax allowed on the installation and would therefore affect a whole host of other activities planned at the same time, so it was important that the lifeboat remains in service throughout where ever possible. Going into the meeting, it was understood that it would be ok; difficult but doable in terms of scaffolding arrangement, protective screens for welding etc. A concern was raised by the construction team in that the job could not be executed without taking the lifeboat out of service, so why had we assumed it would be ok? Again a simple answer; because that was the opinion of the construction representative who attended the previous meeting; that individual has since moved on.
Lessons Learnt
- Continuity is key. Where at all possible maintain key personalities throughout a project in order to help understand decisions made earlier on in the project. Given the recent and still ongoing job losses and efficiency drives in both BP and WGPSN I’m not surprised this has happened. I know I’m not the first person to mention this, and believe it was Angela who made a comment that after 6 months, she was the only person on a project who had been there at the beginning.
- Clear and accurate record of decisions. Whenever key decisions are made make sure it is clearly and correctly documented with any supporting information. The only evidence I had of the test load was in typed handover notes from the previous SPA. If continuity cannot be achieved then this becomes even more vital.
Looking Forward
These issues will cause a delay. Not to the execution offshore phase, as that is in Q2 2016, but certainly to the issue of key deliverables required for offshore execution. Not a concern but if the time lines were shorter then it well could have been. More work now needs to be done to clarify these points and of course man hours means increased costs. It might surprise some of you (or maybe not) that the current budget for this (one might say simple) project is (currently) circa £180k.
Oz PCH – Pipe sizing issues leading to serious commercial implications…
Back in Oct 14 correspondence from NDY (Design Consultants) to Fredon (Mech Installation Subcontractor) raised an issue and posed an RFI regarding both Hot & Chilled water schematics. The RFI asked confirmation that all pipework had been sized and the network designed in accordance with a maximum velocity of 2.5 m/s and maximum pressure loss of 400 Pa/m. Fredon’s reply was yes it had.
In Jan 15 a meeting was held between JHG, NDY and Fredon which highlighted some issues with pipe sizing as referred to above.
In Feb 15, JHG with Cundall (commissioning consultants) conducted a review of all pipework sizing across the project. They found a number of incorrectly sized pipe sections which, although were within the acceptable velocity limits resulted in pressure losses exceeding the maximum 400 Pa/m. These were marked up and sent to Fredon to address asking that they carry out a review to ensure the issues were resolved as soon as possible. In addition it was determined there were also a number of commissioning stations missing (also marked up on dwgs) thus potentially jeopardising the ability to correctly commission the system in accordance with the CIBSE recommendations.
Fredon’s response was they had to change a number of pipe routes due to AHUs and Fan Coil Units moving location in order to make the plantrooms work and all other installed pipework was as per the design schematics from NDY; which didn’t state the 2.5 m/s or 400 Pa/m maximums.
It transpired that NDY did in fact omit the maximum values from their designs, however contractually Fredon don’t have a leg to stand on as all written sub-contracts state that subcontractors are offered the opportunity to review the Client’s Technical Brief and all works carried out must comply with that brief irrespective of any design requirements from the design consultancy (NDY). This case being a perfect example of why subcontractors are offered this opportunity so they can follow the Client’s intent. So, did Fredon view the brief? Of course not! Well not until the preverbal hit the fan.
The exact requirement from the Client’s Technical Brief states:
…pipework shall be designed with a maximum water velocity of 2.5 m/s and maximum friction loss of 400 Pa/m.
Why are 2.5m/s and 400 Pa/m the maximums? Higher velocities create more noise through vibration and higher pressure losses create inefficiencies in running the system and results in increased running costs.
This issue was presented to me on 19 May 15 by my LM to double check that pipe sizing runs in a couple of plantrooms were installed in accordance with the requirements above. There was a fair amount of digging into records etc to get a good understanding of the problem and also waiting for reviews from both NDY and Fredon before the whole picture became clear, hence the date of this blog.
Method
I was given two plantroom schematics; PR 6 (Heating Hot Water) and PR 5 (Chilled Water). Both had the pipe runs annotated with the pipe diameter (mm), flow rate (l/s) and velocity (m/s). Establishing if the velocity was in limits was easy as it was annotated on the dwg but I had to calculate the pressure drop (Pa/m).
To do this I turned straight to CIBSE Guide C Reference Data. I was given a steer that there was a CIBSE version available called the CIBSE Student Guide. This is basically a condensed version of all the most popular and more widely used parts of all CIBSE Guides rolled into one. So I looked here first and found the section with tables on flow of fluids in pipes and ducts. Looking at the Hot Water system first meant selecting the correct temperature (75ºC) and pipe material (copper).
I then simply read off Table C4.13 the closest diameter pipe size to what the drawing said e.g. Ø 65 mm on the dwg would be 67 mm from the table.
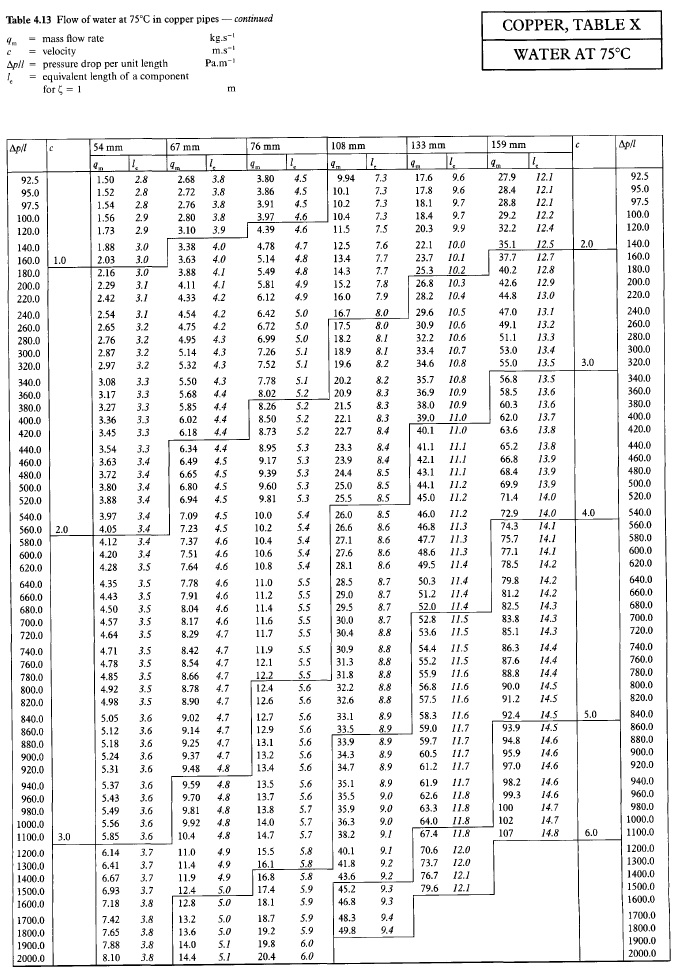
Table C4.13 CIBSE Guide C Reference Data.
Agreed there is a 2mm difference and yes I could simply interpolate between 54 mm and 67 mm from the table but for a quick and dirty answer this wasn’t necessary. Equally if I were to interpolate then I may as well get an even more accurate answer by using the mathematical method. Therefore using the various equations required from the main CIBSE Guide C doc, the mathematical solution is thus:
So it turns out word press won’t allow pasting of equations from word – rubbish!
The D’Arcy equation for pressure loss due to friction:
The friction factor, λ (for turbulent flow) was obtained mathematically from the Colbrook-White equation which is more accurate than using the Moody chart:
Reynolds number:
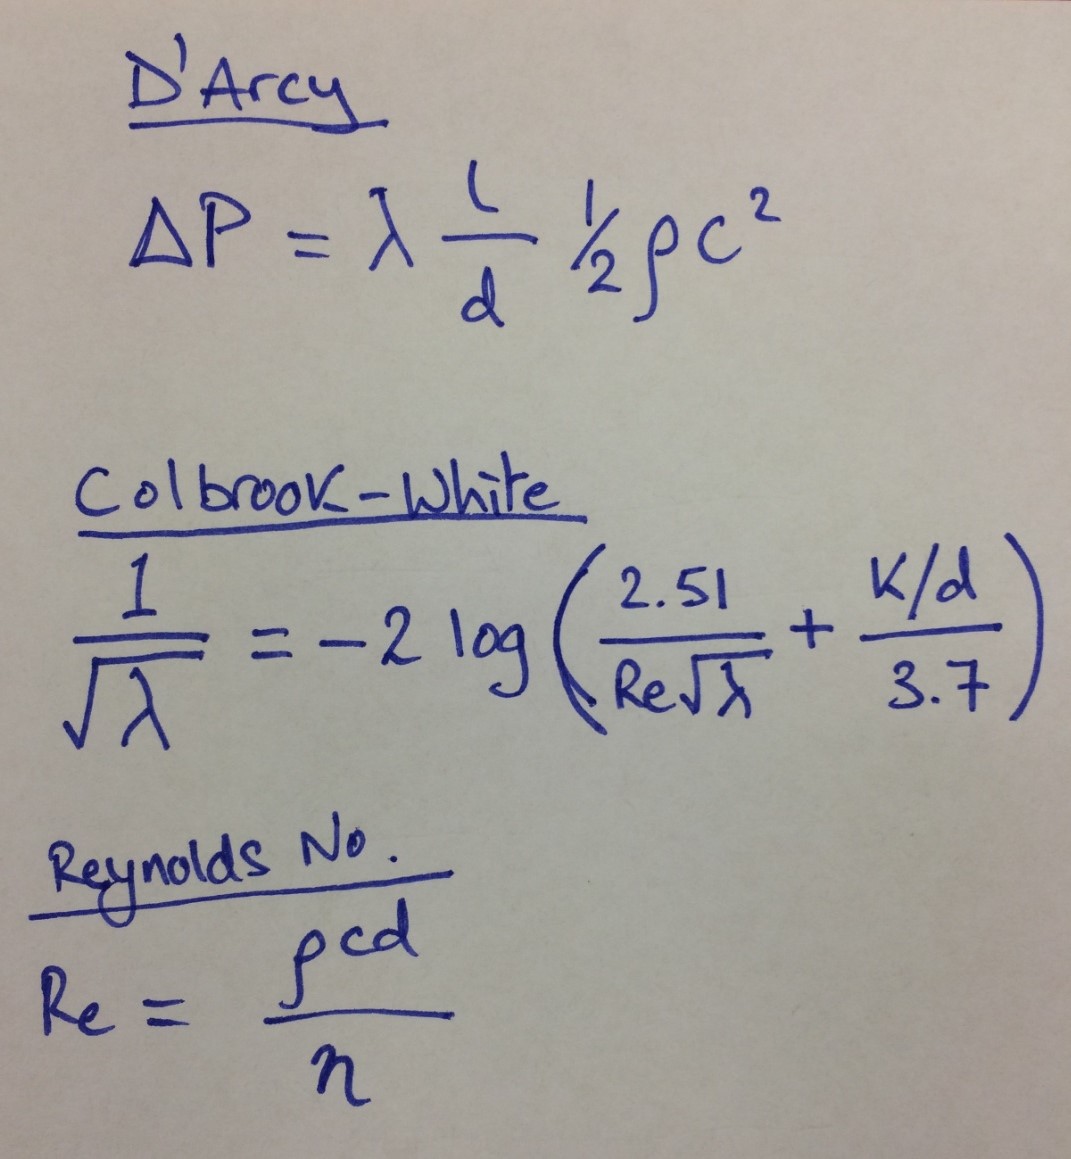
Equations for above.
Relative roughness = k/d
To determine the values of ρ (kg/m3), η (10-6 kg/m/s), and v (10-6 m2/s) properties of water I used Table 4.A1.1 from CIBSE but wanted the temp at 75ºC. So therefore some interpolation was required:
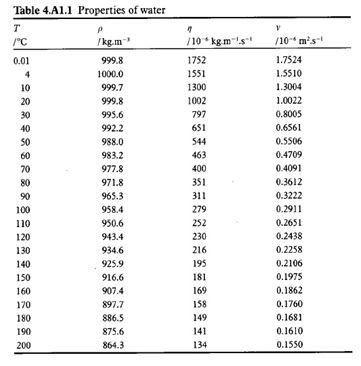
Table 4.A1.1 from CIBSE.
Using a handy interpolation equation:
d = d1 + (d2 – d1) (g – g1) / (g2 – g1)
Calculations
See below hand calculation sheet.
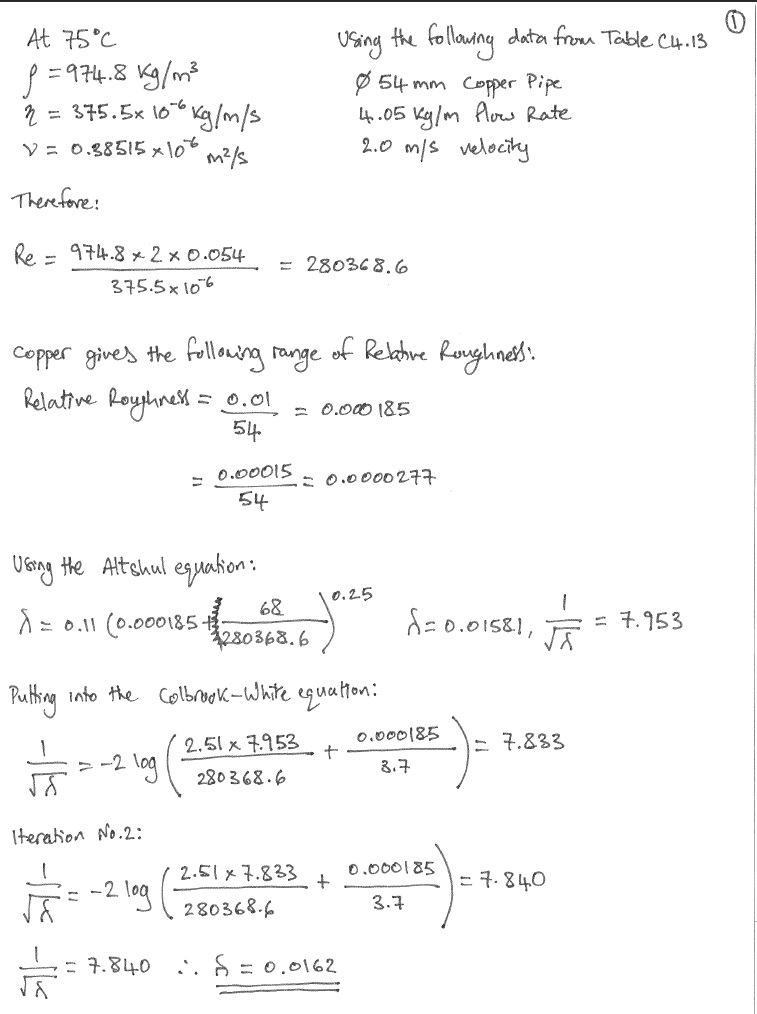
Hand Calculations – Sheet 1 of 3.
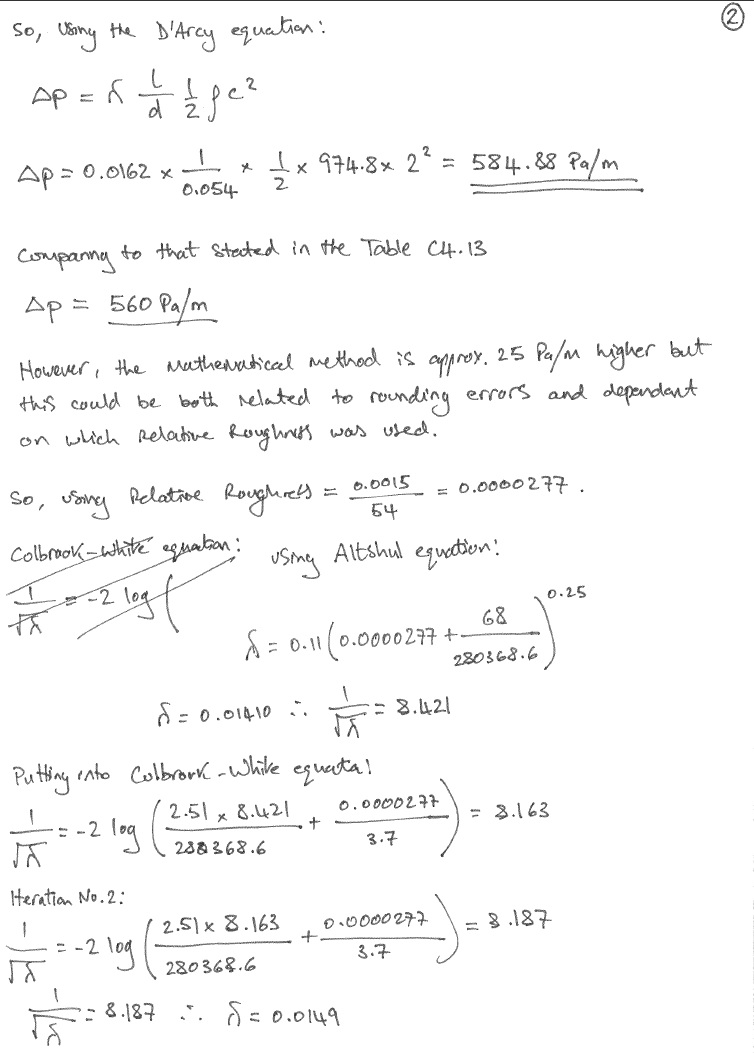
Hand Calculations – Sheet 2 of 3.
Hand Calculations – Sheet 3 of 3.
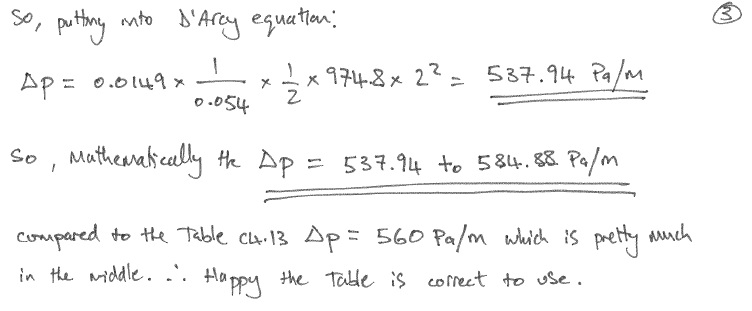
Therefore, if the schematic shows; Copper Ø 65 mm, at a flow rate of 6.63 l/s and velocity of 2.3 m/s the AIRAH charts gives a ∆P = 575 Pa/m.
Mathematically using the same process as above ∆P = 555 to 872 Pa/m.
The closest on CIBSE Table C4.13 is Copper Ø 67 mm, at a flow rate of 6.65 l/s and velocity between 2 – 3 m/s which gives a ∆P = 480 Pa/m.
Mathematically using the same process as above ∆P = 535 Pa/m.
Findings
As a result of checking other PR pipe networks it was found that a number of pipe sections were over the max 400 Pa/m. Therefore JHG issued a Non Compliance Report (NCR) (the highest quality control level of report that gets recorded against the project) stating that we conducted a review of Fredon’s pipework and found as stated above. Both Fredon and NDY went away and also conducted a review resulting in another mtg to discuss the findings along with the contractual implications.
In the meantime I wanted to double check the material for the pipework in PR5 as the pipe equipment in BIM said it was steel yet all other plantrooms used copper. On inspection there was good and bad news; the bad news was I couldn’t find the pipework (only the main 250mm dia supply coming up the riser) but the good news (related to the bad) was it hadn’t been installed yet hence no pipework found. This meant that any pipe sections diameters could be changed thus avoiding an expensive rip-out and re-install.
Steel is cheaper to purchase and more wear resistant than copper however, copper is easier to install (brazing method vs welding of steel) and thus saves time and therefore cost (making copper cheaper overall).
The outcome of this mtg was both NDY and Fredon used pipe sizing charts from the Australian Institute of Refrigeration, Air-conditioning and Heating (AIRAH) Technical Handbook to select their pipes but we couldn’t figure out whey on the same schematic (same velocity and pipe size) they were getting different pressure losses.
We asked Fredon to send us their AIRAH charts and after further investigation we found the error.
NDY say they designed all pipework using steel however their design brief for piping material talks about various materials but doesn’t actually state a design material. Also, there is no mention of material type on any of their schematics. The design brief states:
Pipe sizing on the drawings for pipe fluid velocity, friction rate and pump head calculation are the standard method of size identification for that material e.g. mild steel pipe – DN (nominal bore); copper pipe OD.
Where alternative pipe materials are scheduled as acceptable, the nominal bore of the alternative shall be equal to or greater than that of the nominated mild steel pipe DN.
Fredon made the value engineering decision to install copper and therefore should have understood that when comparing steel and copper the industry norm is to refer to them using their ‘nominal size’. As quoted from the Australian Standard (AS 1074 – 1989)
‘1.3.5 Nominal size (DN) — a numerical designation of size which is common to all components in a piping system other than components designated by outside diameters or by thread size. It is a convenient round number for reference purposes and is only loosely related to manufacturing dimensions’.
However, they should have also realised that steel’s actual internal dia is larger than the stated nominal size compared to copper’s actual internal dia which is smaller than the stated nominal size (copper’s nominal dia is almost akin to the OD (external dia)). This can be seen from the internal pipe sizing table at Table 4.2 CIBSE Guide C and the AIRAH charts below. This comparison is the same for both the UK and Australian construction industries, however, AIRAH present their charts with both materials having the same nominal internal dia and this is what caused the confusion resulting in the errors. NDY designed the pipe networks using steel pipe (e.g. 32mm dia gives 400 Pa/m) but when Fredon changed material to copper they simply used the same 32mm dia pipe. But a copper 32mm nominal pipe has an actual internal dia of 29.26mm which is smaller than the steel pipe’s nominal dia of 32mm (actual internal dia of 36mm) hence over a 6mm dia difference which creates higher pressure losses.
What Fredon should have done was compare the two AIRAH charts by material and therefore upsized the nominal dia of copper pipe to 40mm giving an internal dia of 35.61mm therefore meeting the design brief and thus ensuring a similar pressure loss to that of steel – not exceeding 400 Pa/m.
The charts below show the pressure loss of 82ºC water in both medium steel and copper pipe and compare three different pipe sizes to show the effect the material has on pressure loss.
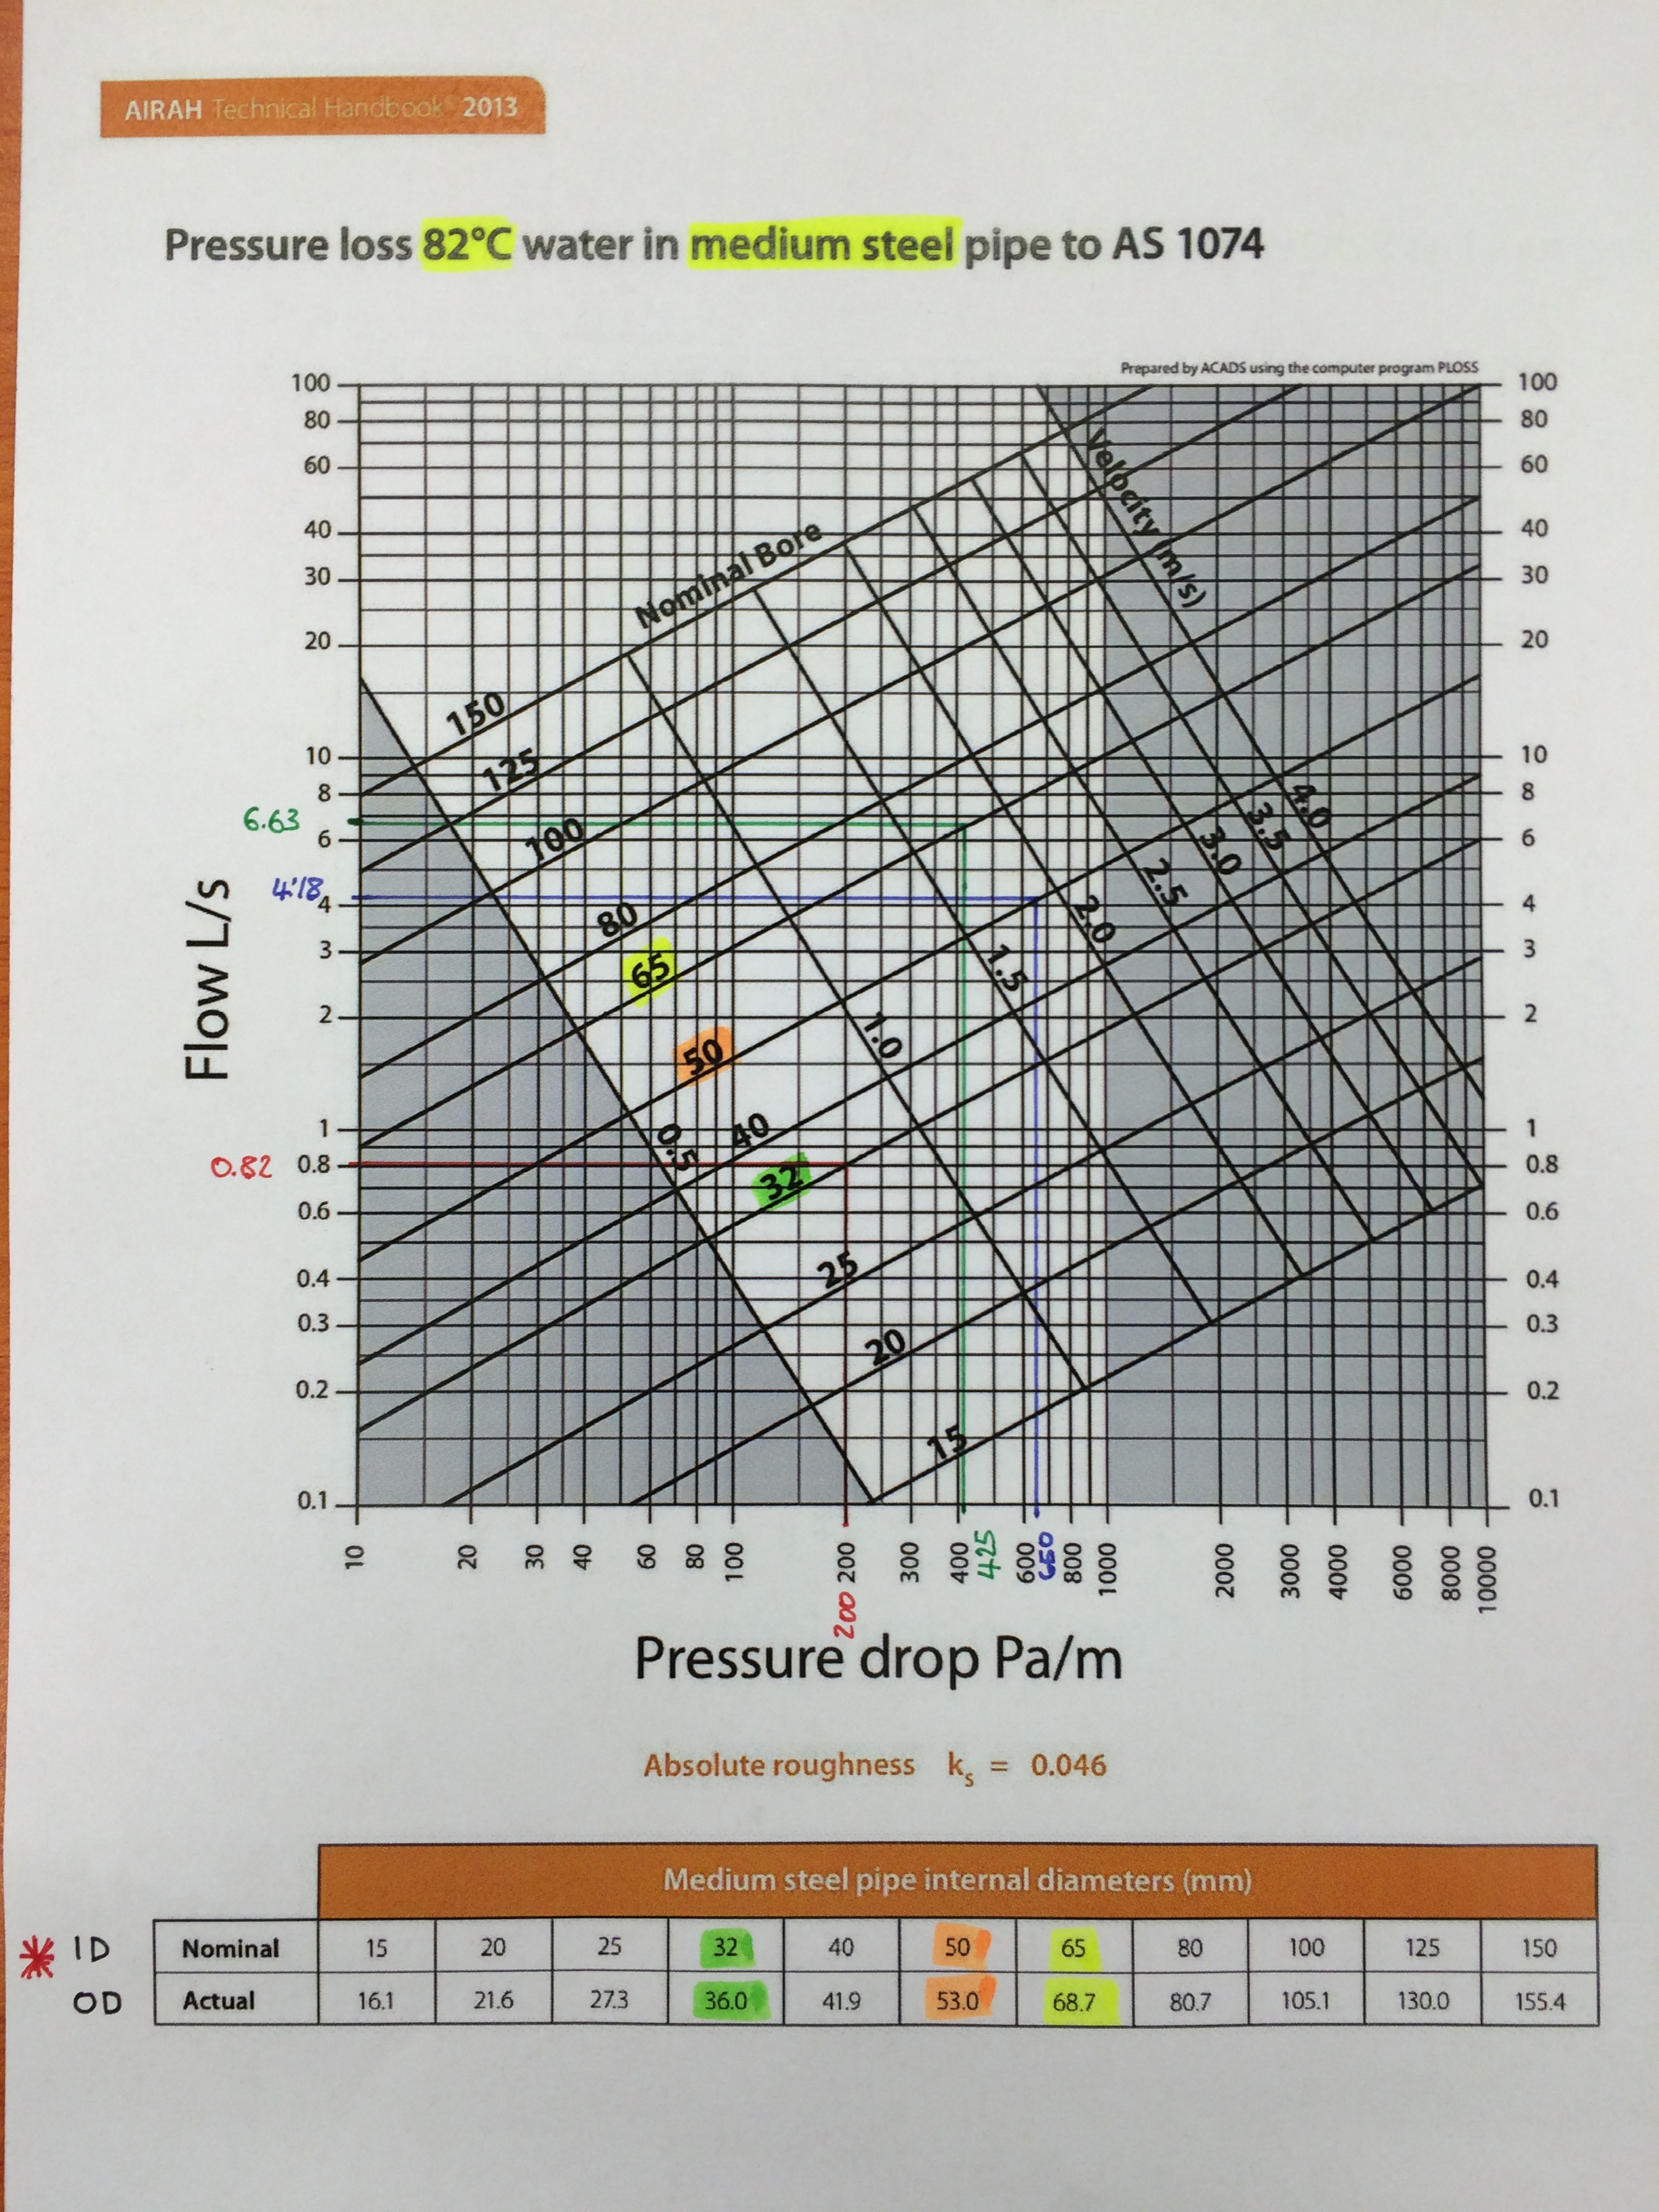
AIRAH Medium Steel Pipe.
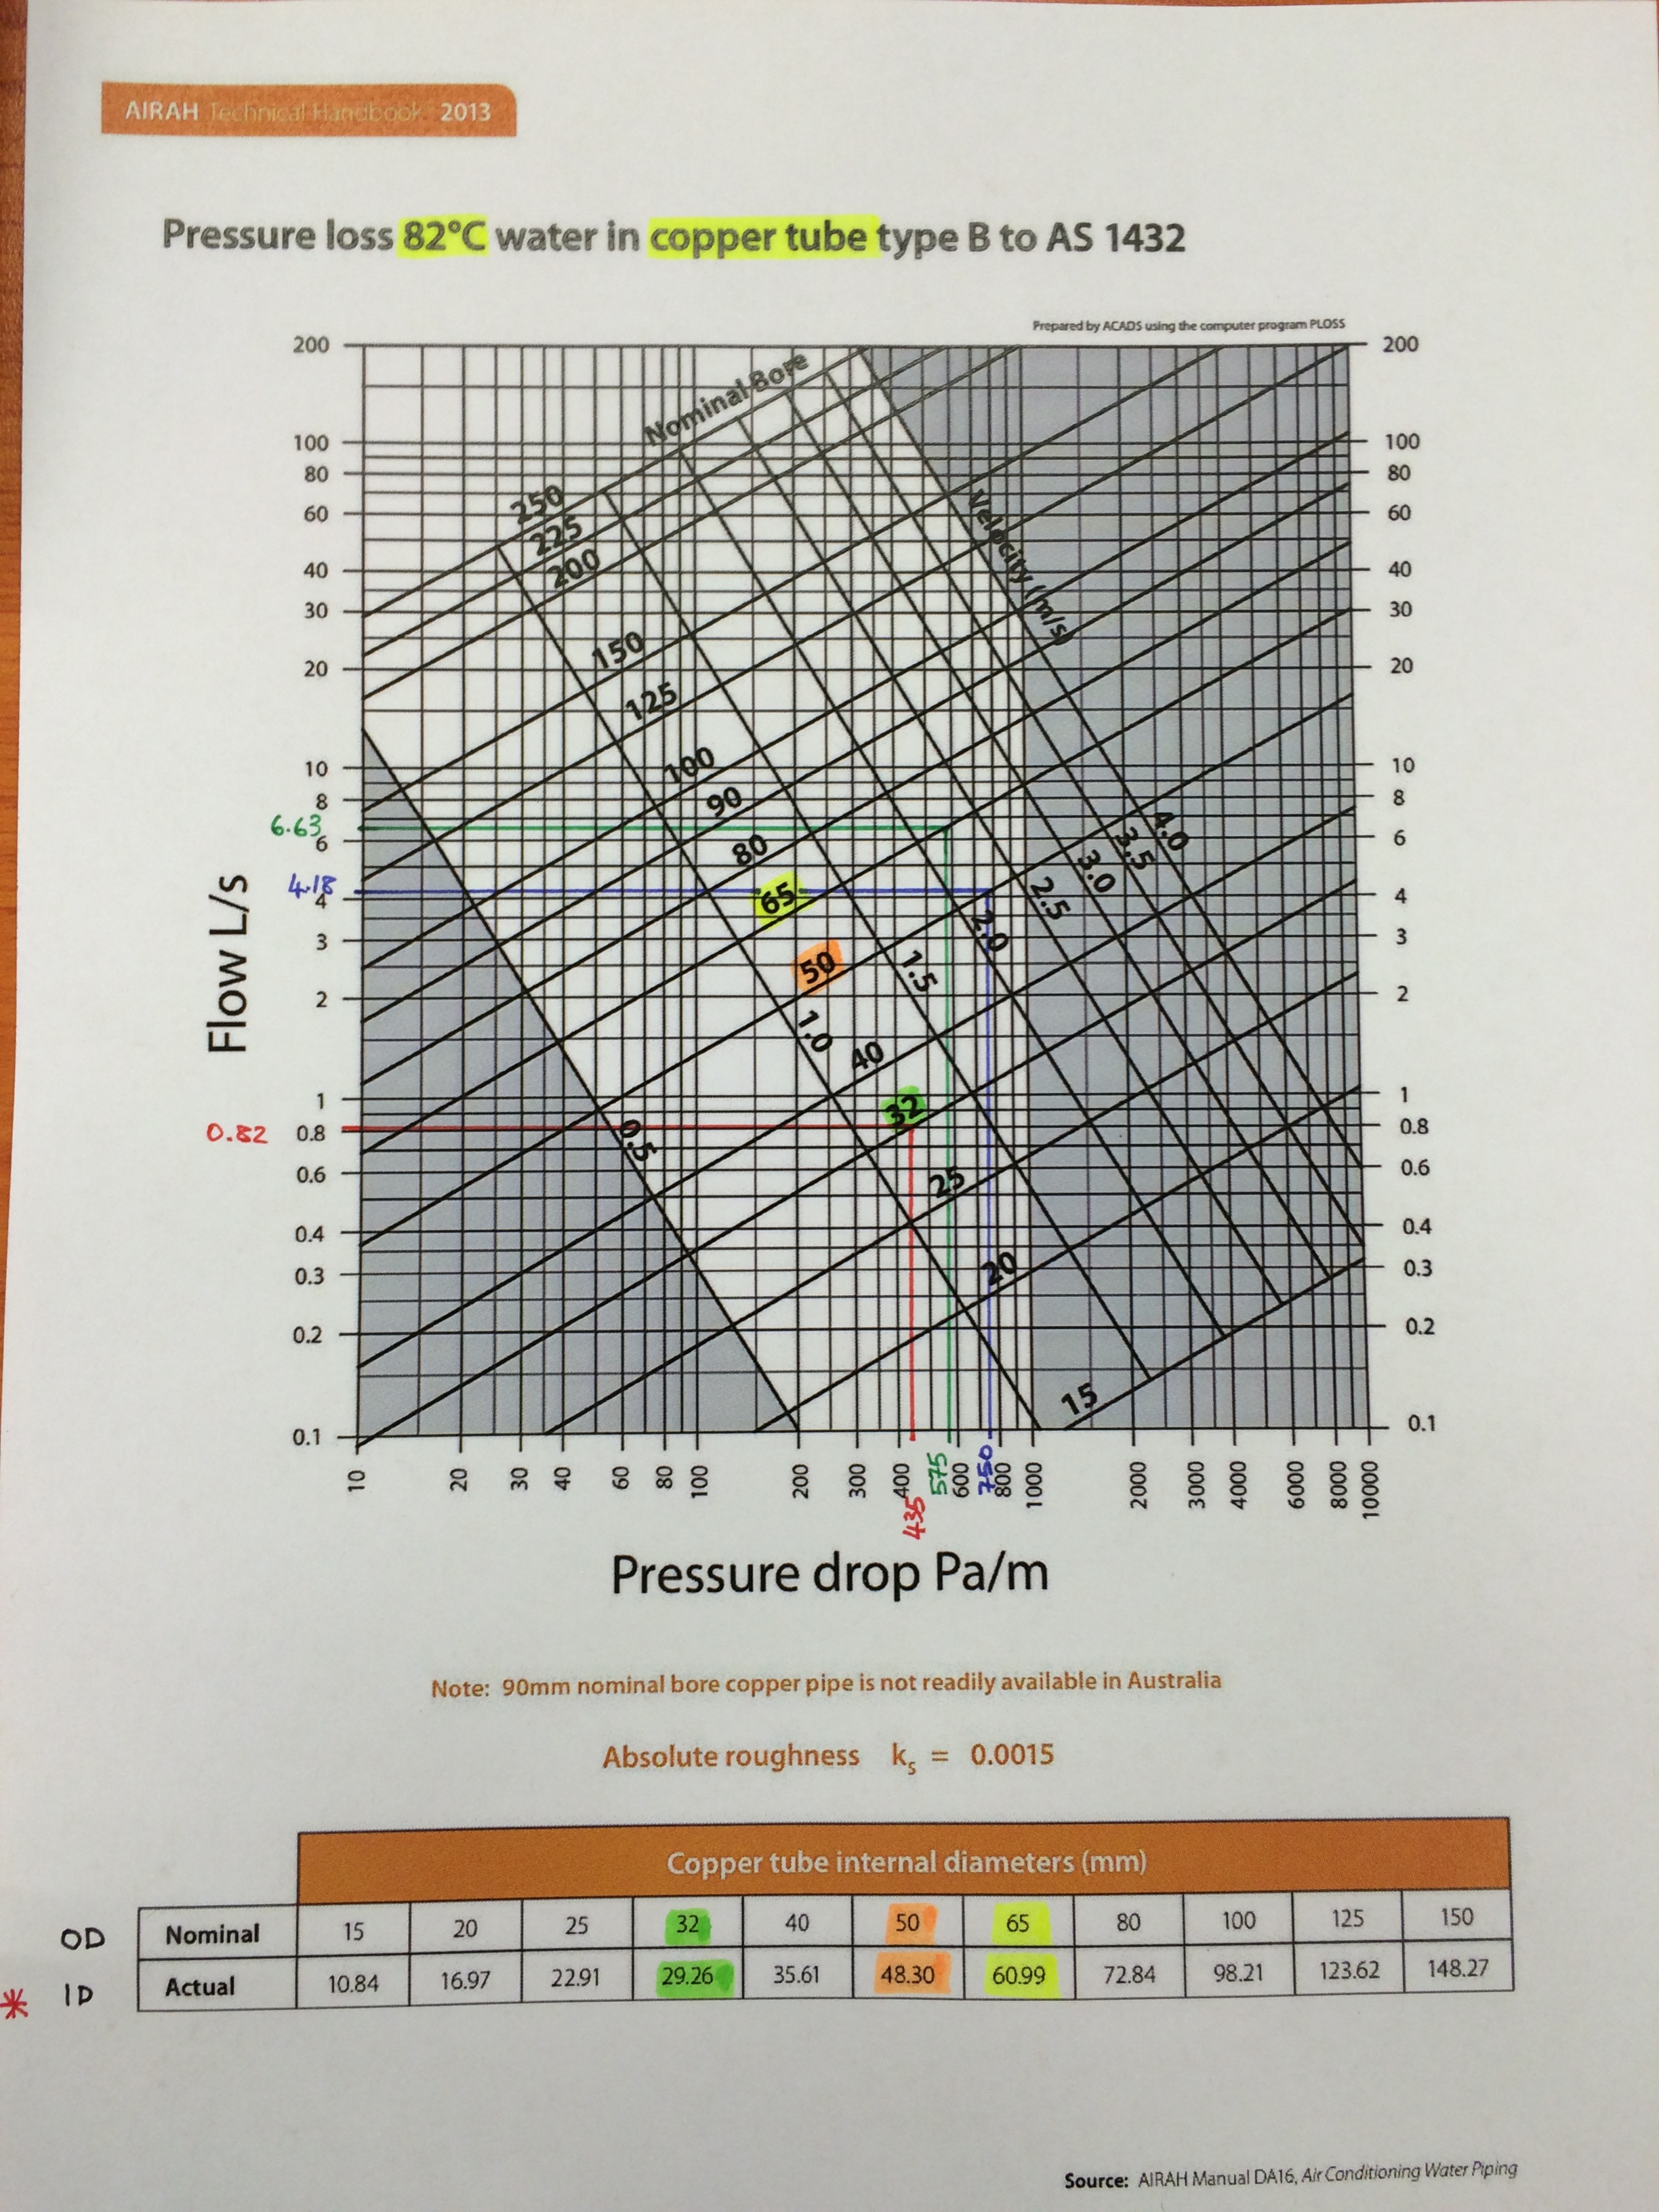
AIRAH Copper Pipe.
So you can see, assuming that you can change from steel to copper pipe (without identifying the nomenclature change AIRAH uses) is incorrect and results in under sizing your pipes thus increasing pressure losses.
This is why the CIBSE Guides and the UK construction industry, on the whole, use different standard pipe sizes for different materials to avoid this confusion. The table below is an extract from the CIBSE Guide C.

Table 4.2 CIBSE Guide C.
So What?
Technically, why does AIRAH refer to both steel and copper piping on their charts using the same nominal dia knowing the actual internal dia is very different?
Why don’t they use a different nominal dimension for say copper like they do in the UK and then have charts that reflect this like Table C4.13 from CIBSE Guide C?
The only dia that actually affects the flow rate and thus pressure losses is the internal dia (the A in Q = A x V), the nominal/OD and wall thickness matter not.
Commercially, JHG need to establish between NDY and Fredon who is the cause of the issue that means JHG currently don’t meet the Client’s brief. They need to establish the extent of what is required to resolve the issue and commercially who will pay for it. When taking into consideration the increased running costs over the lifecycle of the system with pressure losses above 400 Pa/m vs the project resolution (measured by cost and delay to project completion) of ripping out and re-installing new pipework, it could be argued that the latter would be much more expensive. Additionally, Fredon say the pipe runs that are above 400 Pa/m (in most instances around 550 Pa/m) are relatively short and thus the extra cost associated to the inefficiency would be negligible. In which case Fredon would rather pay the yearly additional cost for the lifecycle of the system rather than rip out and start again. Clearly not the point and goes against the Client’s brief and more importantly trying to achieve a system with the best possible energy efficiency thus helping to reduce carbon emissions.
Resolution Options
More importantly, to reduce delays, the resolution is the primary focus. There are two viable proposal options for the Project Director and the Client to discuss: both require proving the extent of the problem and then either; order Fredon to replace all incorrect pipework in PR’s 1 and 2 only (index run) and then request dispensation for the remaining incorrect pipework (doubtful); or order Fredon to replace all incorrect pipework throughout the building. Both have commercial and time implications but the second option could potentially bankrupt Fredon. Therefore, a key factor both JHG and the Client need to seriously consider in order to avoid unnecessary delays are the potential second and third order effects of having to get a different mechanical subcontractor to complete the works (with respect to meeting the project’s practical completion deadline). Either way JHG will still carry the problem to solve on the Client’s behalf.
Conclusions
The above findings don’t resolve the issue but will aid in leading to the correct commercial outcome. Fredon say they were following the NDY design schematics in which case 32mm pipe is correct but only if the schematic doesn’t state steel pipe. If the schematics do then Fredon, deciding to use copper, should have up-sized to 40mm as described above. So, JHG need to establish the material stated on NDY’s schematics in order to identify the faulty party. The truth is that neither NDY nor Fredon are squeaky clean and so commercially they may both end up paying for the resolution.
To resolve the issue JHG are looking primarily at replacing only the incorrect pipework on the index run (PRs 1 and 2). Through Fredon’s as-built drawings they should be able to establish which pipe runs are over 400 Pa/m and by how much and then estimate the extent of time and cost to replace them. Both of which JHG and the Client have a vested interest in keeping to a minimum.
The meeting this coming Monday will be very interesting and I will blog a subsequent update on the resolution and commercial aspects as they come to light.
Recommendations
It could be recommended that AIRAH change their pipe sizing charts to reflect those of the UK construction industry like those produced by CIBSE.
In other news
My collection of sports equipment is steadily growing so I have found a new hobby to help pay for it!
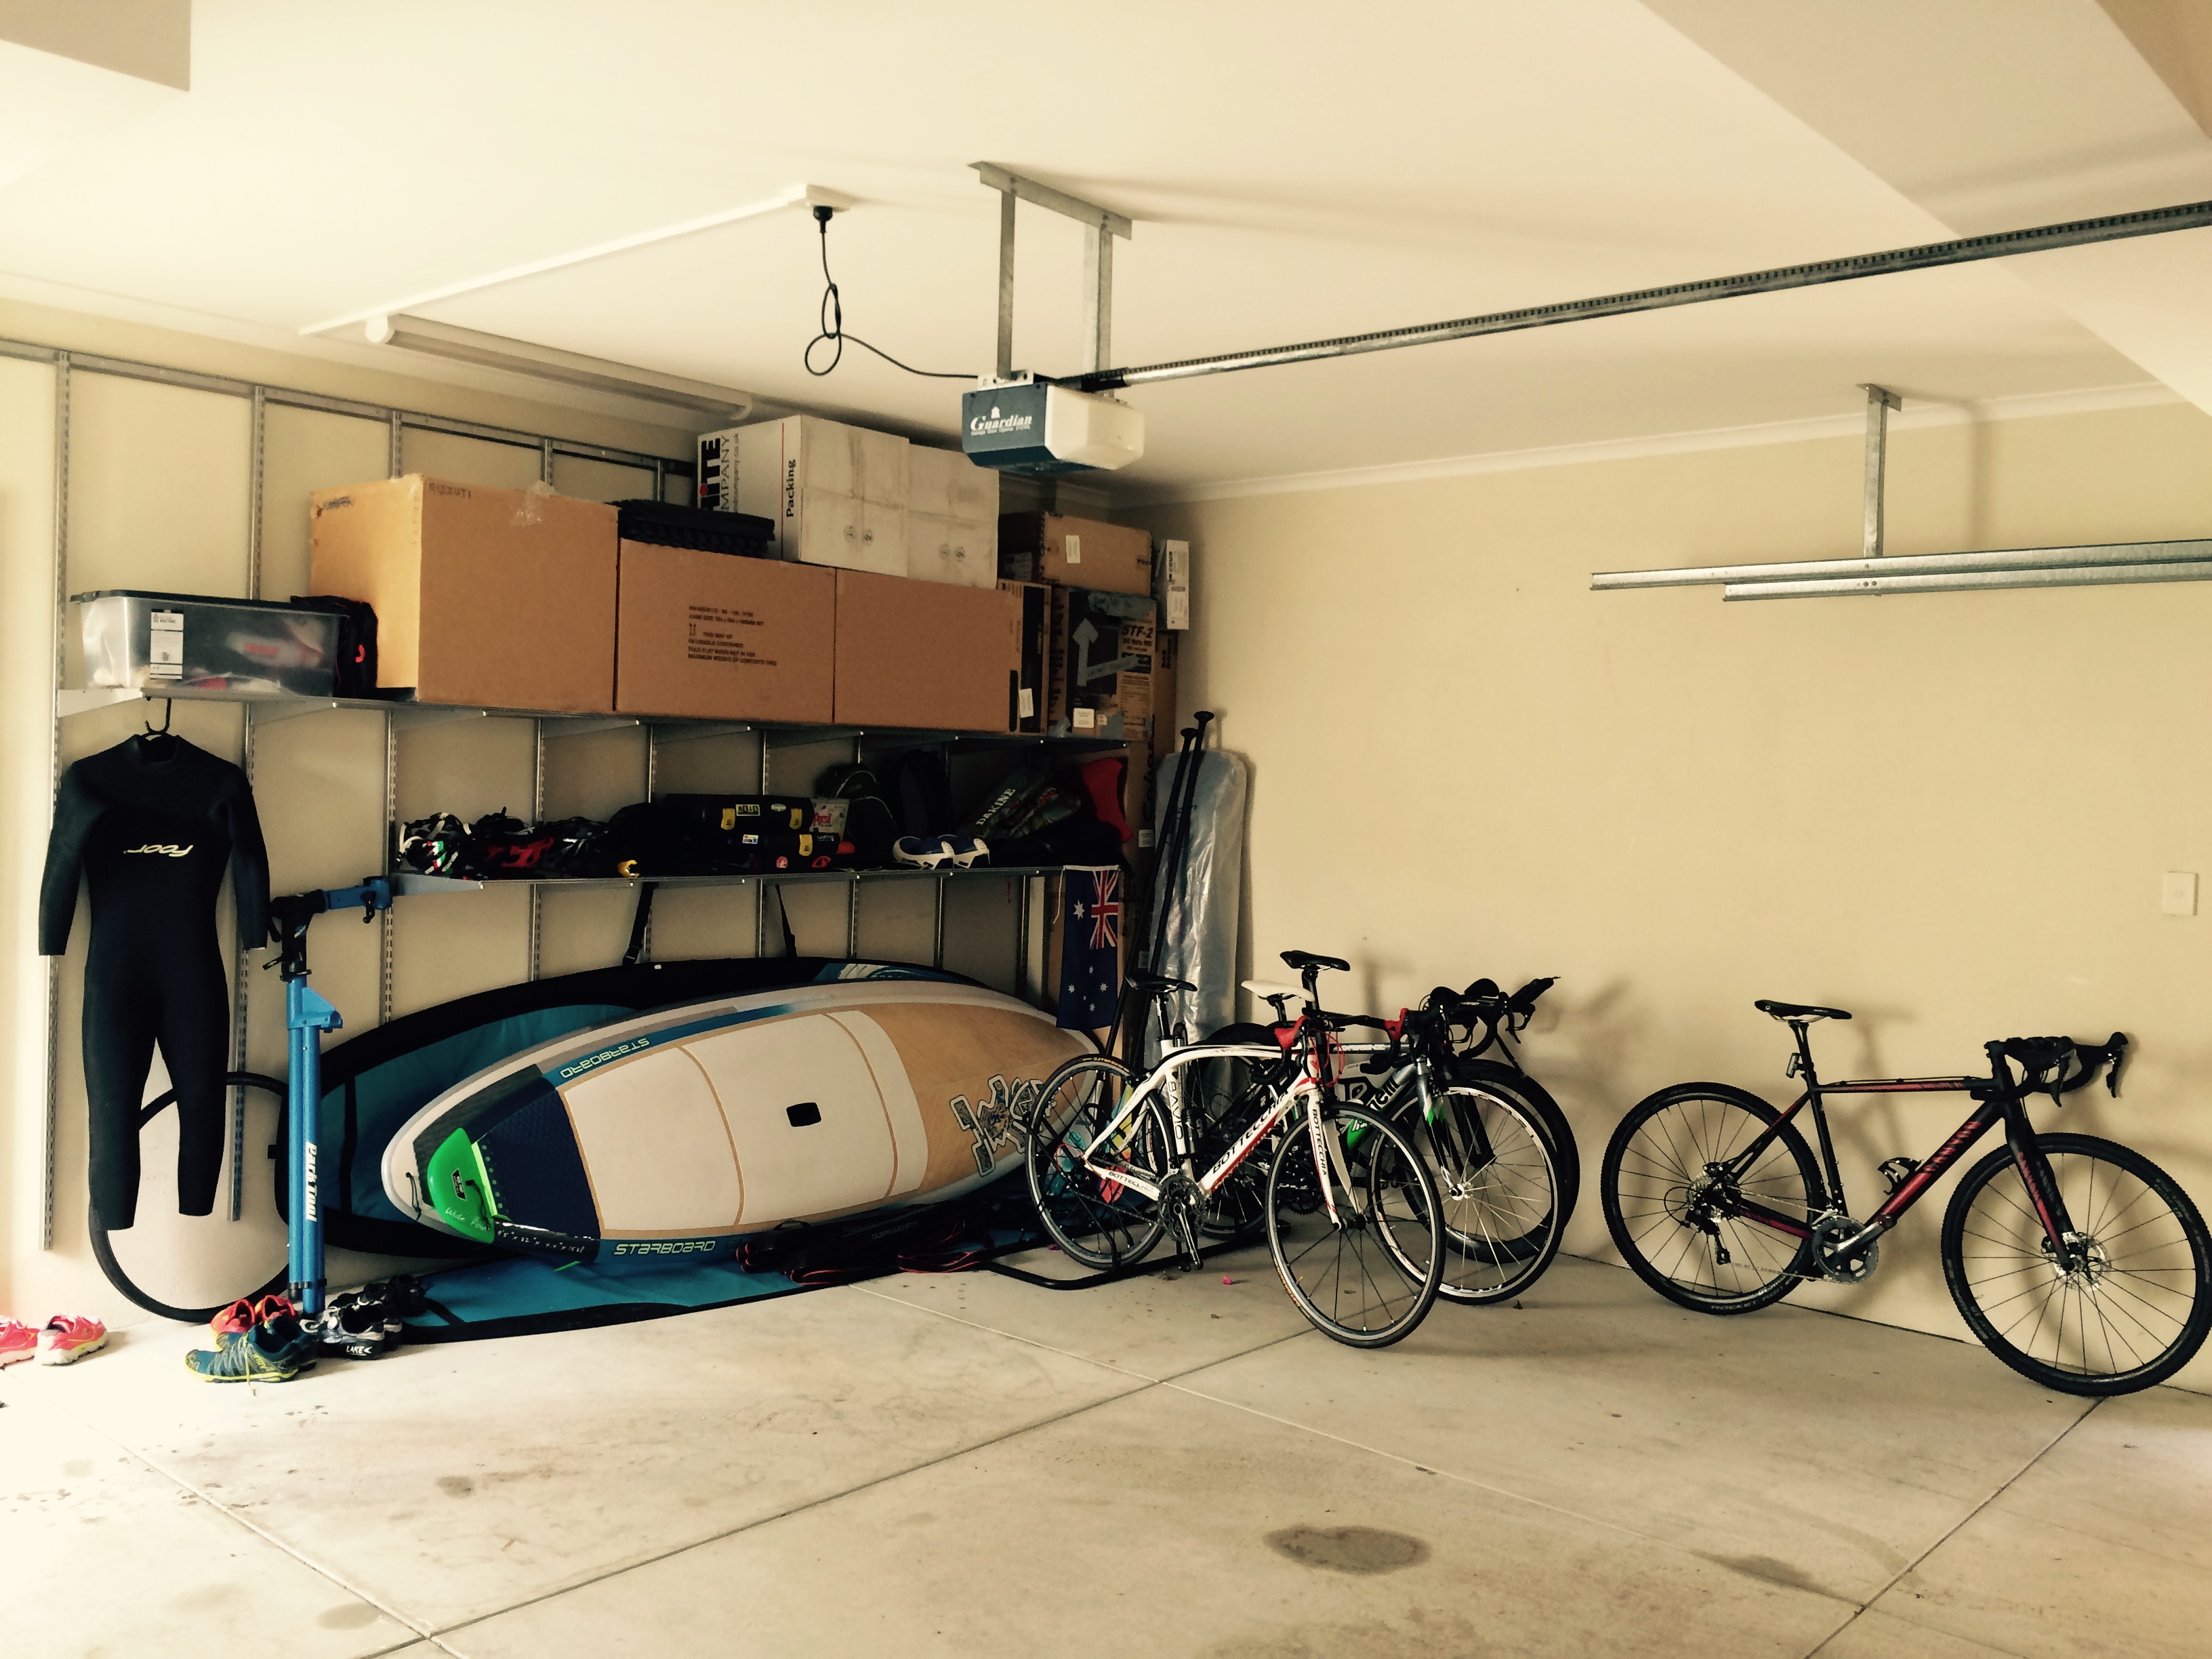
There’s snorkelling gear and a kite surfing training kite on the shelf too!

That’s my winnings!
