Archive
Using Dynamic Pile Driving Formulas on Site
I thought I’d post this blog as it is directly relatable to my thesis topic and highlights the risk of ‘boundaries’ regarding geotechnical engineers and pile design.
The marine piling package is well underway on my project, with 5 piles installed to date. I am not overseeing this package (I am focussed on substructure works on the eastern bank of the site) but have been keeping myself up to date with the marine piling QA as my thesis is aimed around pile driving formulas and will use primary data from our pile driving records/CAPWAP analyses.
A few weeks back, one of our piles (P1-P09-PSP-01) was driven to design depth but failed to reach End of Dive (EOD) capacity, recording a set of just 5.1mm per blow at ~280kj of energy. This pile is an open-ended steel tube with a diameter of 1600mm, pile wall thickness of 25mm and pile shoe of 1m long by 50mm wall thickness. It is designed to carry a geotechnical design load of 21MN.
Piles have been driven using an IHC S280 hammer, and was initially driven with Pile Driving Analyser (PDA) equipment to a penetration of 21.77m (-32.36m RL). The PDA EOD indicated that the pile had an inadequate resistance at this depth. The PDA equipment had to be removed due to the risk of water damage (i.e. the gauges were at risk of being submerged in the River). A CAPWAP analysis was carried out on one of the final blows at this stage of re-driving, also proving inadequate capacity.
Though both a borehole was taken at each pier location and the pile itself was fabricated with an extra 2m length to mitigate risk of failing to reach capacity at design RL, this situation highlights the risk of certainty in geotechnical boundaries.
The pile was driven further without PDA monitoring and the set was monitored using survey. The pile was driven to a final toe level of -32.8m RL. The final set achieved was 1.6mm (per blow) at maximum hammer energy (~280 kJ). This was positive, suggesting the basalt rock layer had been established.
For the project to date, PDA testing and CAPWAP analysis have been undertaken on all previous marine piles to confirm capacity. This has enabled correlations to be developed to PDA/CAPWAP to pile installation parameters (i.e. you can use sets achieved on previous piles to estimate pile capacity). As no PDA equipment was attached for the final driving of the pile (and thus no possibility of CAPWAP analysis), an alternate approach to pile capacity verification was required.
Without going into too much detail, hundreds of dynamic pile driving formulas have been derived since the mid to late 1800s. In Victoria, the Hiley Formula is referenced for use in VicRoads publications, which is dated and requires input of several parameters. One such input is the Temporary Compression (TC) measurement of the pile (effectively the energy lost during hammer impact due to elastic compression in the pile, soil and cap). TC energy losses are on of two types on losses experienced, the other be Newtonian Impact Theory (effectively a coefficient of restitution that is used to indicate how much of the original kinetic energy remains after the impact of two objects)
TC could not able to be recorded onsite due to the difficulty obtaining this measurement due to the pile becoming submerged and the hammer sleeve ‘covering’ the top of pile. This prevented the Pile Driving Monitor (PDM) from being used to record TC.
Therefore, the geotechnical engineers required use of a pile driving formula that does not incorporate TC. Stringent rules allow for this and is only considered appropriate in cases where:
-
- There is a high proportion of piles subjected to PDA/CAPWAP;
- Hammer energy measurement is undertaken to confirm hammer performance;
- There is a high level of engineering supervision and the standard of piling QA is high.
These requirements were considered met so the geotechnical engineers decided that the ‘Gates Pile Driving’ Formula (developed in 1957) would be used to allow estimation of pile resistance. The Gates Formula is as follows:
𝐺𝑎𝑡𝑒𝑠 𝑅𝑒𝑠𝑖𝑠𝑡𝑎𝑛𝑐𝑒 𝐹𝑎𝑐𝑡𝑜𝑟 = 27 ∗ √𝑒ℎ ∗ 𝐸 ∗ (1 − 𝑙𝑜𝑔10 (s/25.4))
where: s is set in mm
eh is hammer efficiency (assessed as efficiency of energy transfer to the pile from PDA measurements on other representative piles)
E is the hammer energy delivered to the pile.
As the Gates Formula was developed in US units (i.e. kips, ft) the formula does not result in a resistance in metric units (i.e. kN). To avoid the need to convert all units to US and redefine the constants in the equation, the Gates Formula was used to evaluate a ‘Gates Resistance Factor’ which is proportional to the estimated resistance. Importantly, this is subsequently correlated to CAPWAP resistance.
A correlation factor is necessary between the GRF and the PDA/CAPWAP capacities determined from analysis on representative tested piles (i.e. piles already installed). This correction factor is termed Gates Correction Factor (GCF) and is calculated as:
𝐺𝐶𝐹 = CAPWAP Resistance / 𝐺𝑅𝐹
|
Test No. |
Toe Level (Test) | Pile Penetration (Test) |
Driving Stroke |
EOD
Driving Set |
Driving TC |
Test Type |
Test Set |
EMX |
RMX |
Potential Energy |
Hammer Efficiency |
| – | m RL | m | mm | mm | mm | – | mm | kN- m | kN | kN-m | – |
| C1-P03- PSP-03 EOD |
-31.53 |
19.33 |
2040 |
0.50 |
13.90 |
EOD |
0.5 |
248 |
33529 |
280.2 |
88% |
| C1-P03- PSP-04 EOD |
-32.45 |
15.65 |
1600 |
1.40 |
12.60 |
EOD |
1.4 |
218 |
28303 |
219.7 |
99% |
| C1-P03- PSP-04 RST | -32.45 | 15.65 | 1700 | 1.40 | 12.60 | RST | 0.7 | 228 | 29517 | 233.5 | 98% |
| C1-P03- PSP-04 RDV |
-32.45 |
15.65 |
2040 |
1.40 |
12.60 |
RDV |
1 |
269 |
32231 |
280.2 |
96% |
| C1-P03- PSP-02 EOD |
-35.10 |
13.00 |
1600 |
2.30 |
11.70 |
EOD |
2.3 |
207 |
19863 |
219.7 |
94% |
| C1-P03- PSP-02 RST | -35.10 | 14.50 | 2040 | 2.30 | 11.70 | RST | 1.3 | 269 | 25067 | 280.2 | 96% |
| C1-P03- PSP-01 EOD |
-35.07 |
13.20 |
1455 |
2.80 |
10.20 |
EOD |
2.8 |
191 |
18827 |
199.8 |
96% |
| C1-P03- PSP-01 RST | -35.07 | 14.30 | 2040 | 2.80 | 10.20 | RST | 1.7 | 270 | 24708 | 280.2 | 97% |
| P1-P09- PSP-01 RDV |
-32.36 |
21.77 |
2040 |
5.10 |
– |
RDV |
5.1 |
276 |
22475 |
280.2 |
98% |
The table above demonstrates the results of the testing conducted (EOD and CAPWAP) on the 4 previously installed piles for correlation for Gates. The table below shows the pile resistance factor values calculated from the Gates Formula, as well as capacity evaluated from CAPWAP and the GCF.
For all tests (excluding Pile C1-P03-PSP-03 EOD which is considered unrepresentative) the energy efficiency ranged from 94 to 99% (an important parameter for formula input), with an average of 96.8. A Lower Bound efficiency of 94% was adopted in estimating resistance for pile P1-P09-PSP-01.
|
Test No. |
Gates Resistance Factor |
CAPWAP Compressive Capacity |
GCF |
| – | – | (kN) | |
| C1-P03-PSP-03 EOD | 1149 | 33500 | 29.1 |
| C1-P03-PSP-04 EOD | 900 | 25555 | 28.4 |
| C1-P03-PSP-04 RST | 1044 | 29570 | 28.3 |
| C1-P03-PSP-04 RDV | 1065 | 32280 | 30.3 |
| C1-P03-PSP-02 EOD | 792 | 19700 | 24.8 |
| C1-P03-PSP-02 RST | 1014 | 25080 | 24.7 |
| C1-P03-PSP-01 EOD | 730 | 18790 | 25.7 |
| C1-P03-PSP-01 RST | 966 | 24670 | 25.6 |
| P1-P09-PSP-01 RDV | 761 | 22315 | 29.3 |
The Gates resistance values are generally seen as lower than the CAPWAP resistances with GCF values from 24.8 to 30.3. These are plotted against pile set below to provide a line of best fit of pile set against the Gate Factor. Using this and the set obtained at EOD (1.6mm) for pile P1-P09-PSP-01, the GCF equates to ~27.
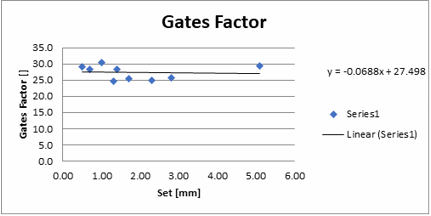
Using the below parameters, The Gates Pile Driving Formula estimates a resistance of 26,173kN at end of redrive.
Set = 1.6mm
Hammer Energy = 280kJ (IHC S280) Hammer Efficiency = 94% (LB)
Gates Correlation Factor = 27
This is well above the required capacity of the pile (~21MN) and is therefore considered competent. In addition to this, the previous piles have demonstrated a ‘set up’ (refer to my previous post) of 15%-31% increase over 24 hours (minimum required time between EOD and Restrike Test (RST)) – See table below. This suggests further assurance to capacity and thus QA of the pile.
|
Test No. |
Compression Shaft Resistance |
Toe Resistance |
Compression Capacity |
Toe Level (Test) |
Shaft capacity improvement (%) |
Overall Capacity Improvement (%) |
| kN | kN | kN | mRL | |||
| C1-P03-PSP-04 EOD | 8055 | 17500 | 25555 | -32.450 |
146% |
115% |
| C1-P03-PSP-04 RST | 11770 | 17800 | 29570 | -32.450 | ||
| C1-P03-PSP-01 EOD | 7390 | 11400 | 18790 | -35.070 |
161% |
131% |
| C1-P03-PSP-01 RST | 11970 | 12700 | 24670 | -35.070 | ||
| C1-P03-PSP-02 EOD | 7700 | 12000 | 19700 | -35.100 |
150% |
127% |
| C1-P03-PSP-02 RST | 11580 | 13500 | 25080 | -35.100 | ||
| P1-P09-PSP-01 RDV | 9765 | 12550 | 22315 | -32.363 |
152% |
124% |
| Average | ||||||
The use of the Gates Formula on site to assure capacity of this pile has been, coincidently, very useful for my Thesis and demonstrates alternate methods of assuring quality. The importance appears to be in the ability to both/either accurately measure parameters/input data on site and correlate results with a data set. Without having yet asked, I wonder what the solution might have been had this been the first pile? Maybe install further piles and hope to achieve resistance and use the parameters obtained to correlate as was in this case? Or would they have bit the bullet and spliced the pile on site – rather tricky being in a marine environment from a barge, especially given the high QA regime and Workplace Health & Safety controls?
The most expensive cubic metre of grout?
The Plan
The casting of the column bases into the pile heads is one of the key early stages in my project. To (try to) ensure the quality of this operation a carefully staged process was developed with hold points and hand over inspections involving the concrete and steel sub-contractors, the principle contractor and the designer.
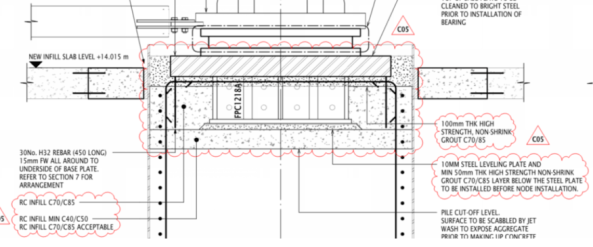
Design build up beneath the base plate within the pile casing
To leave space for the steel shear keys beneath the base plates the pile concrete cut-off level was left short of the top of the casing. The process for installing the base plates became a 6 stage operation as follows:
- Prepare the pile head as handed over by scabbling the surface and extending the rebar cage where required. Pour C70/85 concrete to achieve desired pile level, ~50mm below the bottom of the shear key.
- Install a 10mm steel levelling plate.
- Grout beneath the levelling plate using a high strength (100MPa) ‘non-shrink’ grout.
- Install the main baseplate with shear key and temporary works.
- Pour C70/85 concrete to within 100mm of the bottom of base plate.
- Pour high strength grout (100MPa) beneath the bearing surface of the base plate (max 100mm thickness) and up the sides to top of steel. Grout was specified to ensure full dispersal of the mix beneath the plate to ensure full contact with the bearing surface to satisfy the design bearing pressures from the column into the pile.
All stages had gone as planned until the final (and most important) stage.
The Execution
Unfortunately, our ‘specialist’ sub-sub-contractors clearly didn’t get the memo (or any training in mixing grout it seems). While mixing the bagged grout on site they ignored quality procedures and, following a mechanical failure with the volumetric doser, ended up adding water to the mix using the ever accurate bucket method.
The result is unlikely to surprise anyone. The grout was considerably over watered and separated in the pile casing. The cementitious content has fallen to the bottom topped by a layer of polymer additives, all submerged under 90 mm of bleed water.

Bleed water from the separated grout pour
There were immediate concerns over the strength of this grout layer and the 7-day cube result shows 39.1 MPa against a forecast compressive strength at this age of 75 MPa and a design target strength (28 day) of 85 MPa. This raises all the usual issues with failed quality tests but owing to the criticality of this bearing surface a remediation plan must be put in place within the month. Any longer than that and the designers cannot guarantee the structure for further steel erection – all of which is on the critical path.
With no float left in the programme following delays elsewhere (see my earlier blog on off-site programme) any critical delay to the programme will incur damages and costs totalling close to £1M per week.
So what are the options?
The Hope
Owing to the cause of this non-conformance (over-watering) there is no confidence that the cube result represents the in situ condition so additional testing is required. We will also take smaller core samples through the base plate’s vent holes to ascertain the profile of the grout across the bearing surface (see below).
I have uploaded an In Situ Testing Techniques guide from one of our sub-contractors for interest but for this problem we are taking simple core samples for compressive strength testing (BS EN 12504).

Core locations in failed grout layer
The hope is that a core can return a result approaching 50MPa and that the design engineer can justify this reduction in strength from the design. I suspect this is highly unlikely on both counts so what is the fall back?
The Contingency
The only fall back is to remove the grout but the access is extremely difficult. The current proposal is for hydro demolition with a curved lance to access the gap between the casing and the base plate. This is currently under review but adjusting the power of the lance should allow for the removal of the weak grout without damaging the concrete of steel beneath.
This requires considerable planning effort and time to execute. This will be followed by installing the grout again properly. And the clock is ticking before damages begin.
Lessons Identified
- A specialist is not necessarily any more competent than any one else in any given task.
- Adding water to concrete/grout, beyond mix design, is a bad idea.
- Paying to do the job right the first time is cheaper than rectifying mistakes if they happen.
- It doesn’t take long for a simple task to slip onto the critical path.
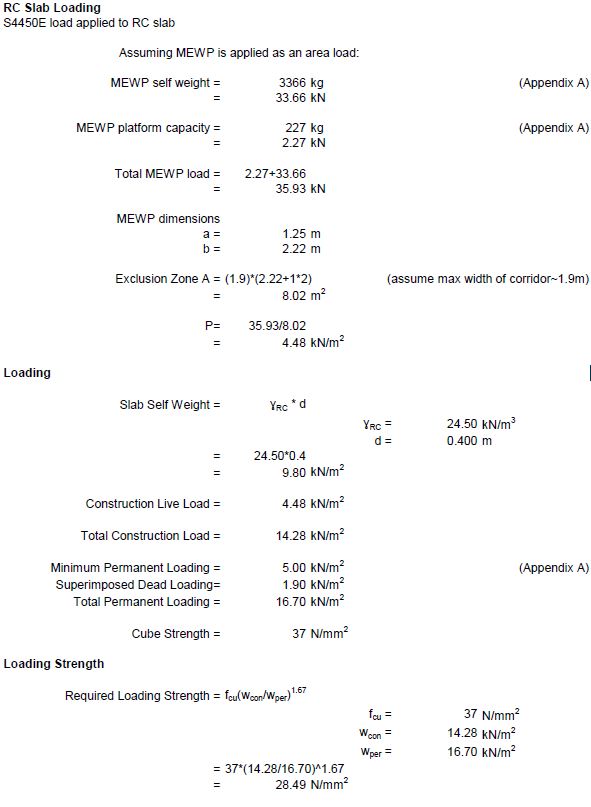
Temporary works design – MEWPs
General. I have been reviewing the temporary works design that we have received on site for the use of some MEWPs on our suspended slabs. Two different MEWPs are to be used, one at approx 35.9 kN when loaded with a small footprint (1.25×2.22m) and a larger version, 69.3 kN when loaded with a footprint of 2.27×5.47m. The maximum slab span in the working area, is a two way spanning 9.48×6.4m with a qk of 5.95 kN/m2 and 6.9 kN/m2 in the smaller area shown below.
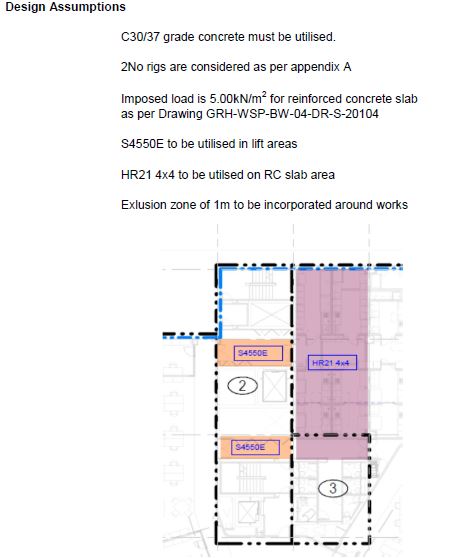
Temporary works designer (TWD) assumptions
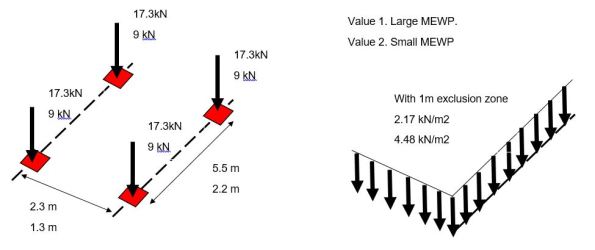
Method. I initially did some conservative calculations applying the combined load of two wheels at the mid span compared against the design UDL to check the TWDs value. The temporary works designer however has applied the MEWP as an area load with the addition of a 1m exclusion zone around each one. They then verify that this is less than the permanent loading before stating the loading strength required of the concrete. Note the loading strength is not a concern as the slabs have reached their permanent strength.

Limitation. An exclusion zone is normal around a MEWP however as work progresses equipment and furniture may already have been installed and so the surrounding area may not be completely clear. Also note the smaller MEWP must work in a corridor so a smaller exclusion zone has been included above.
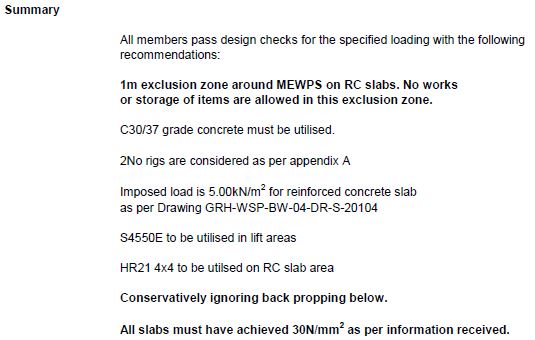
TWD summary
Question. Is it appropriate to apply a vehicle load as a UDL in this way (this reminds me of the UDLs/tandem systems we used in bridge design)? Should alternative load models have also have been used to check this was the most onerous version?
Design Risk? Perhaps think twice or double-check…
I’ve delayed sharing this post as I was waiting for the completion of the investigation report however it looks like it will continue for some time. The information in blue italic text is taken from the draft incident report summary prepared by the safety team on site. I’ve also interspersed comments and pictures to aid understanding. This incident is a sharp reminder of design responsibility as we look to transition onto Phase 3 next month. At the heart of the incident is the combination of 5 issues:
- Incorrect design/design shortcuts
- “I’ve done this before/This is how we did it last time”
- Short notice change of plan on site
- Lack of communication between the site team
- The interface between unplanned or different activities on site
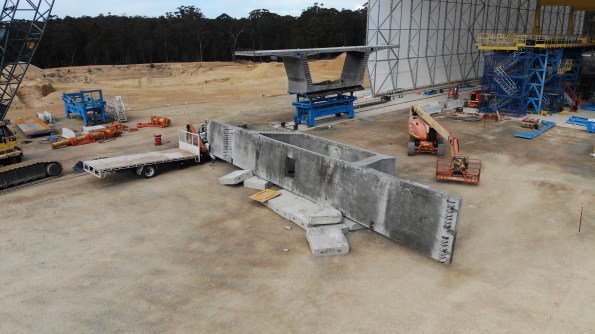
First, a few pictures to whet your appetite to read further…

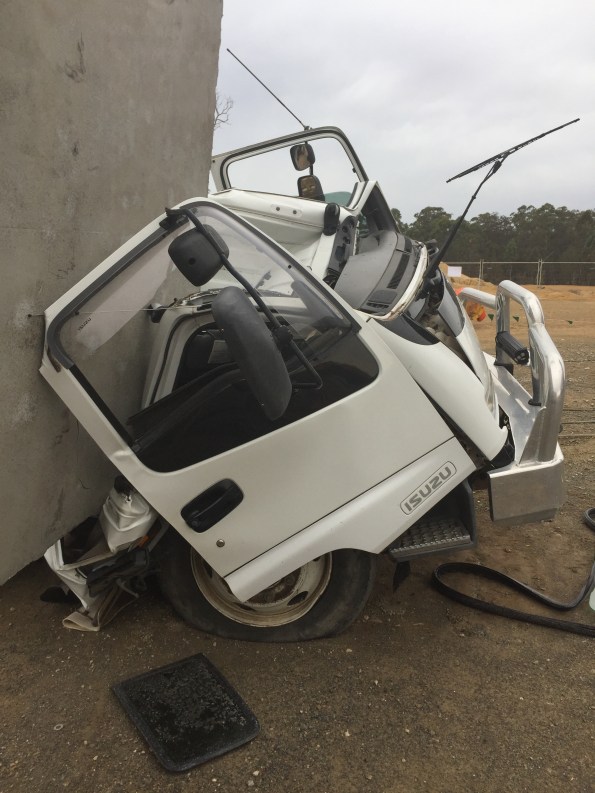

Now the pictures have got your attention I thought I would share a little bit about the serious incident that happened at the pre-cast yard in September. The incident was classified as a 1P incident under the John Holland system. 1 = most serious (deadly consequence) P = potential (fortunately there were no injuries). The incident cost is valued at A$ 100,000
Executive Summary
John Holland has been engaged by Roads and Maritime Services (RMS) to construct a new bridge on the A1 Princes Highway over the Clyde River at Batemans Bay. The new bridge will improve access to Batemans Bay and surrounding areas, allow access for larger trucks, reduce traffic delays and improve the Kings and Princes Highways intersection
The project involves the upgrade of approximately 1.55km of Princes Highway between North Street and Kings Highway from predominantly two lanes to four lanes, two lanes in each direction. It includes a new 420m long bridge over the Clyde River, located to the north-west of the existing bridge. The bridge consists of a total of 168 segments currently being manufactured at the projects temporary precast facility located approximately six kilometres south of Mogo.
At 09:00 on Friday 20th, September 2019 a 250-tonne crawler crane lifted Segment P5-1U (the segment) off the transfer table and placed the segment on support pads. The segment weighed 95 – tonnes. The support pad arrangement consisted of three support points, two on one side and one on the opposite side, the pad on the single support point taking fifty percent of the load.
A section of the support pad arrangement is shown below: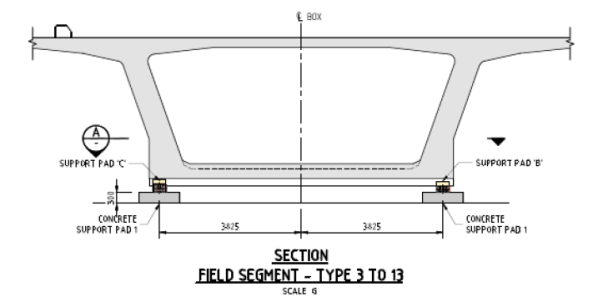
The support pads consisted of a concrete pad with a specified shim arrangement on top; the shims consisted of an anti-slip rubber mat, sandbag, and timber shims made from TRU Form and LVL plywood. Each segment had a specific support pad shim arrangement to suit the segment profile detailed in the Temporary Works 23 design package (TW23).
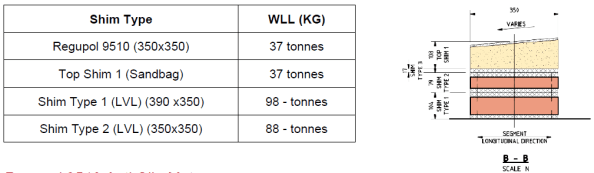
An example of the shim arrangement is shown below. The WLL table was produced as part of the post-incident analysis and was not available on-site prior to the incident.
Segment P5-1U was one of the larger segments cast to date and as a result, was to be utilised during the Straddle Carrier Crane Safe load test scheduled for Tuesday 26th September. The Straddle Carrier WLL was 110 tonnes. The Crane Safe certification test required a test load of 110% (121 tonnes).
On Saturday 21st September, the Precast Manager instructed the crane crew to place concrete pads next to the segment in preparation for the load test. Later the crew were instructed to load four concrete pads onto the Segment. Between 10:00 – 12:00 four concrete blocks, each weighing 2.2 tonnes, were placed by the crawler crane in predetermined locations on top of the segment to achieve the required weight for the Safe load test.
The following table shows how support pad B was overloaded by 28.4% prior to adding the concrete blocks and 40.3% after adding the blocks.

At approximately 12.30 a truck arrived from the main bridge site, returning a spreader beam. The truck driver was instructed by a rigger to park within the radius of the nearby crawler crane. The crane crew unloaded the spreader beam; the truck driver then proceeded to prepare his truck for departure.
I highlight the interface between concurrent activities on site which contributed to the severity of the incident.
At approximately 12.55, almost 28 hours after placing the segment, the truck driver was standing at the back of his truck and heard a noise. Upon looking up, he saw the segment moving at which point he quickly moved further away from the back of the truck. The segment then fell over, landing on the cab of the truck and concrete pads.
The truck driver had just tightened his last truck ratchet strap and was about to get back into the cab of his truck.
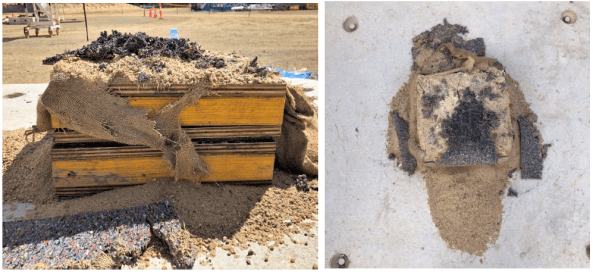
The following picture shows the failed shim. The grey/black material is the Regupol mat.
The Precast Manager immediately attended the incident scene and, having determined no one was injured, secured the area and ceased all works in the precast yard, and made the required notifications.
Key findings:
• The WLL of the anti-slip rubber mat was not checked during design
The design had been used previously on another project in Sydney however the segments on that project had a maximum weight of 70 tonnes.
• There was no technical specification for the sandbag in the design
• The WLL of the anti-slip rubber mat was exceeded by 10.5 tonnes (28.4%) prior to the placement of the concrete blocks (8.8 tonnes) and by 14.9 tonnes (40%) when the additional 8.8 tonnes was added for the Straddle Carrier Safe load test
The issue of the inadequate design was exasperated by a site change to the load test procedure.
• The TW 23 design package was assessed as Low Risk, requiring no independent design certification. Had the risk been rated as “significant” (i.e. by way of Catastrophic consequence and Unlikely frequency, independent design certification would have been required.
• Support Pad inspection on P5-U identified there was not full contact between the various shim layers and the segment. Thus load transfer may not have been evenly distributed across the surface and may have resulted in potential point loading. This may have placed further stress on the anti-slip rubber mats
• The support pad design was not reviewed following initial issues observed with the sandbags during the placement of the segment P5-U
However it was discussed with the Engineers, Precast Manager and TWC.
• Support pad failure was not identified as a risk when planning the Safe load test, therefore no exclusion zone established around the segment.
Hence the truck was directed to park within the crawler crane radius for unloading. This was next to the stored segment.
Actions:
• Establish an exclusion zone around segment P5-U
• Design a temporary support system to secure Segment P5-U, before lifting and reseating on the new temporary support system.
The segment has been quarantined and cannot be used. It will now be crushed for disposal.
• Review Segment Storage Pad (TW23) design and design validation by an independent professional engineer
Works in progress.
• John Holland TEK Team shall conduct a project-wide Temporary Works Audit (3 days)
• Review the Design Management Plan to include the requirements of JH-MPR-DES-003 TEMPORARY WORKS DESIGN AND IMPLEMENTATION
• Review the Temporary Workers Register classifications and ensure design verification and validation is completed in accordance with JH-MPR-DES-003 TEMPORARY WORKS DESIGN AND IMPLEMENTATION
Review and audit of all TW activities and processes conducted by an independent JH team.
• Review [Activity Method Statemet] to include temporary pad installation and segment placement, detail all temporary works design requirements associated with the activity.
• Develop [Task Risk Assessment] specific to the task of pad layout, installation and placement of segments
• Inspection and Test Plan (ITP) check for pad configuration and shim configuration
• Project Wide toolbox discussing the importance of speaking up if you have an issue or concern
• Communicated Change Management requirements to the wider project team
▪ SQE Risk Management
▪ Design Change
▪ Resources (plant, people, equipment)
Pile Cap Anchorage
We are currently constructing some pile caps on site. 3,4 and 5 group caps varying between about 1.2 and 2m squared and between 500mm and 1500mm deep. The piles are in place and are being broken out to leave 800mm anchorage standing proud.
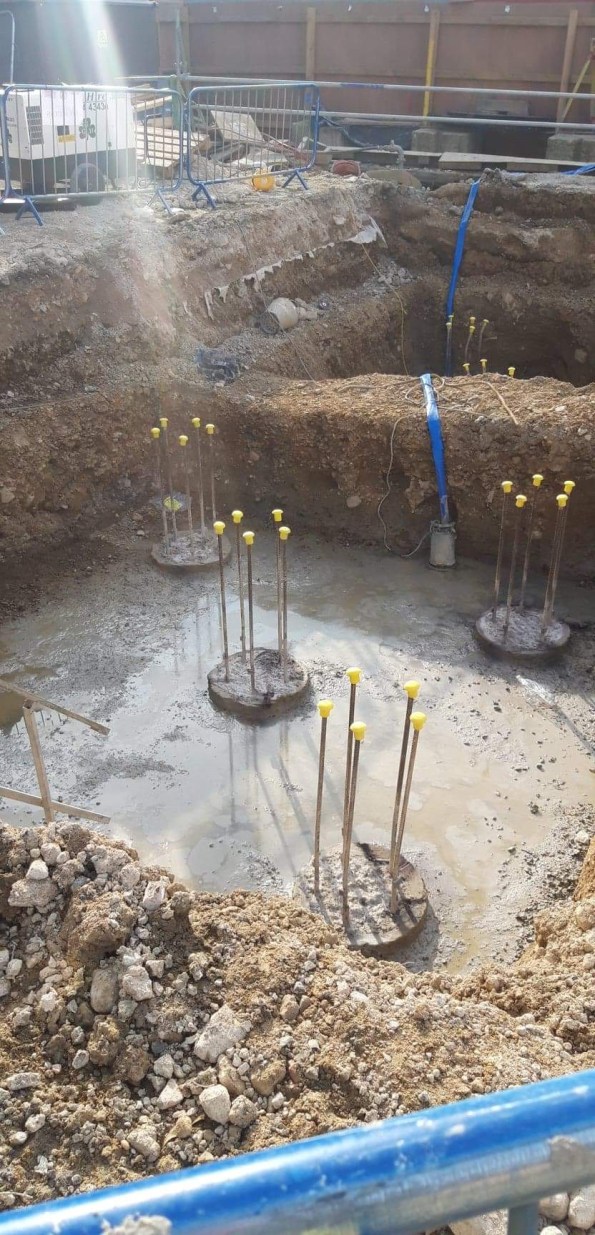
The problem is that because of time pressures the caps are now prefab and dropped in as this is a faster process. The challenge is, how do you bend the Anchorage once an entire cage has been places on top?
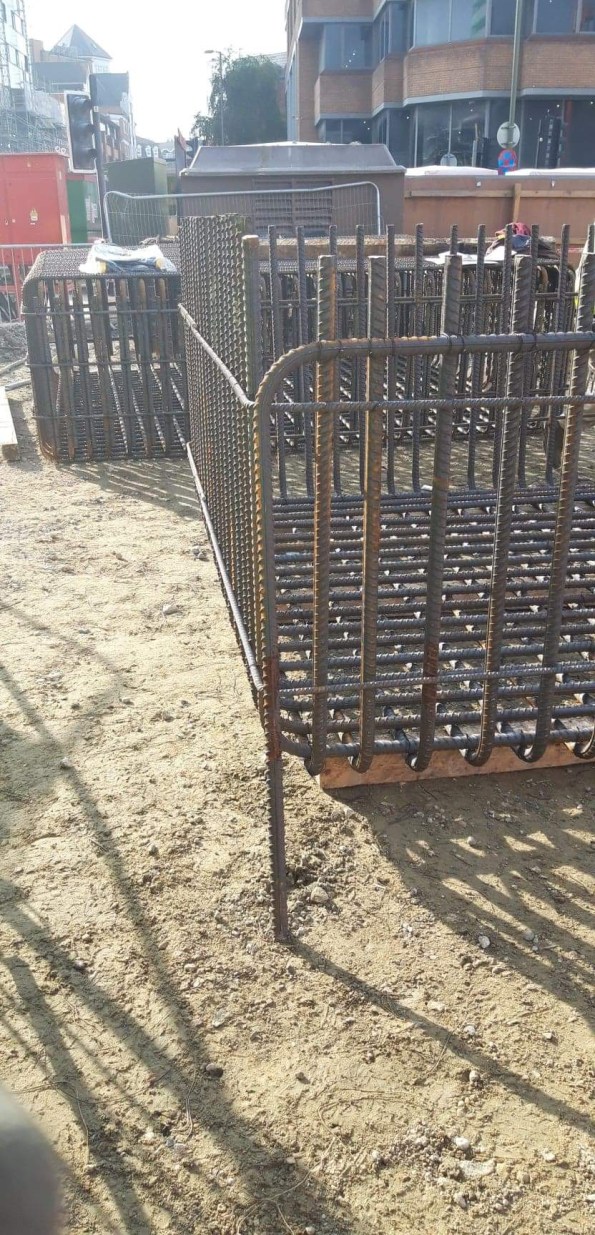
Does the Anchorage NEED to be bent? The 800mm Anchorage does actually stick out above the smaller pile caps as seen below.

Has anyone encountered this and seen a solution?
