Archive
Australian Fires
Hopefully this post will keep the E&Ms happy as it has nothing to do with engineering!
Some of you will have seen the Australian Bushfires on the news and just flicked past the articles without too much thought.
A few weeks ago, the fires were particularly bad west of Sydney, causing the air quality in the city to be equivalent to smoking 40 cigarettes a day.
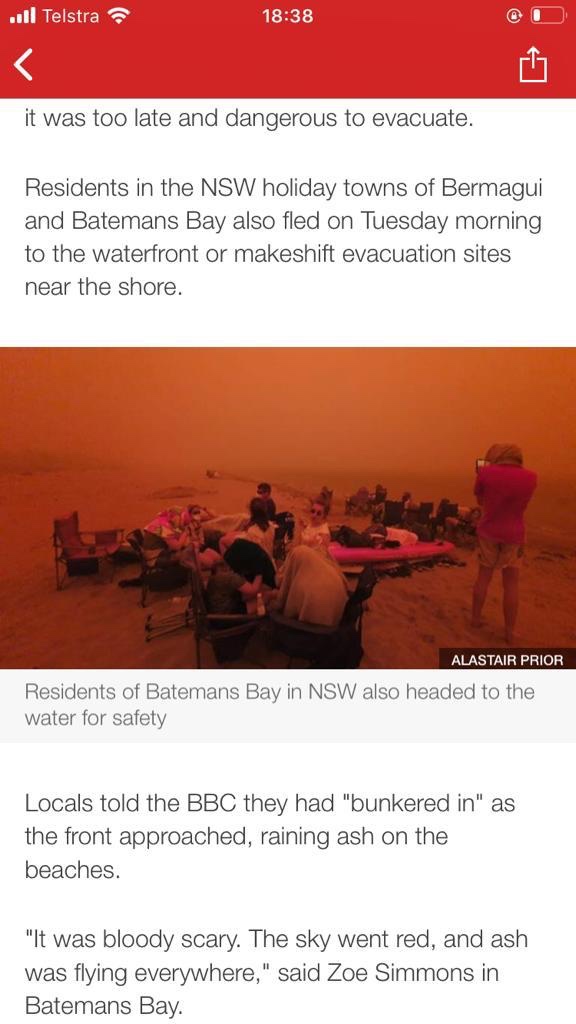
Most of the Australian countryside is like a tinder box with high temperatures and little rain making it perfect conditions for the fires which have continued to spread. Last night strong winds and dry lightening storms added to the number and scale of the fires. (The winds were so strong a volunteer fireman was killed when the wind lifted and overturned his 10t truck).
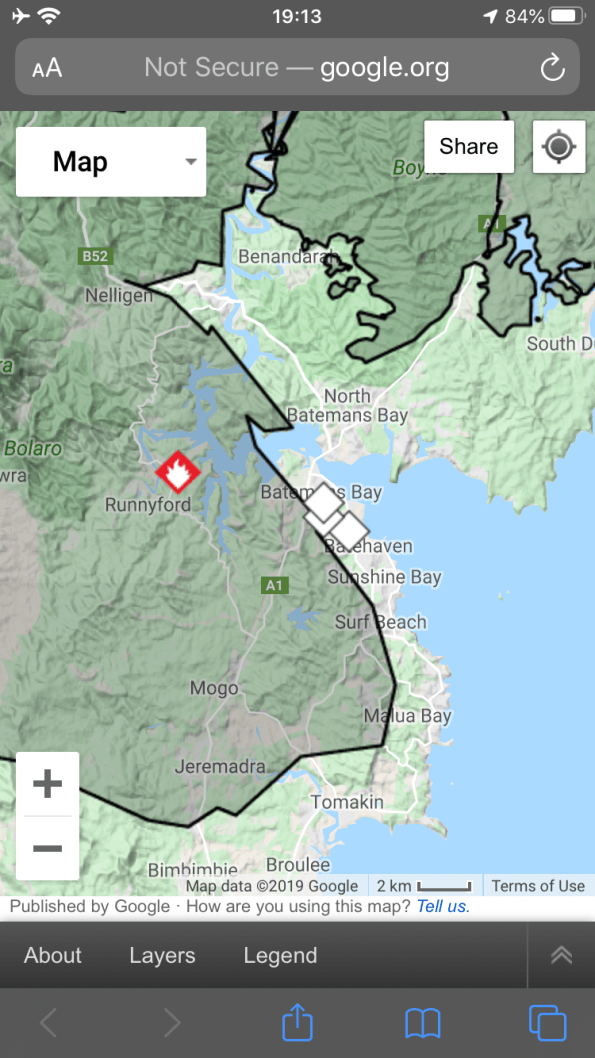
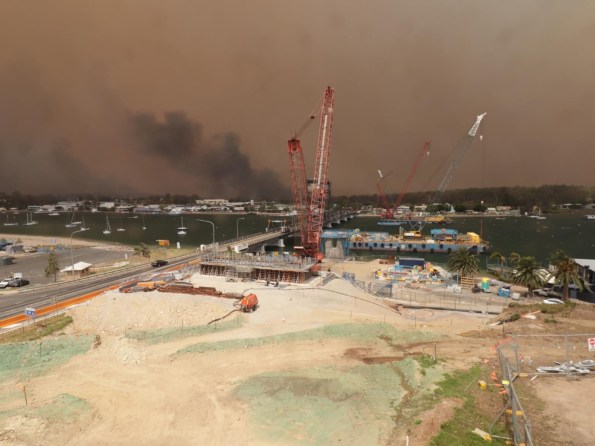
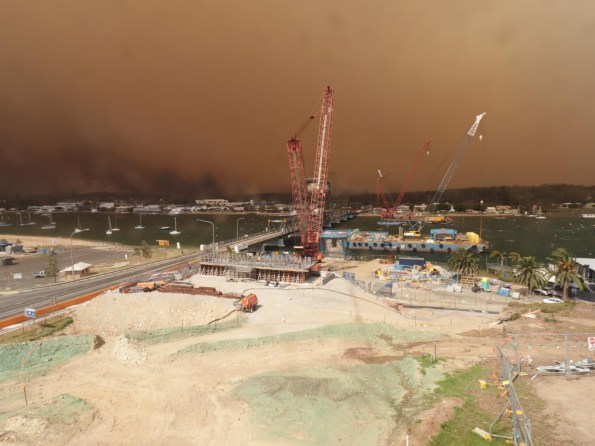
This morning we got a text alert notifying us of an emergency fire situation in Batemans Bay where my site attachment was (we moved down to Melbourne 4 weeks ago). I viewed the online fire tracking website which showed the town is practically cut off by fires. This prompted me to log onto my old project time-lapse cameras to take a look. (Pictures taken one daylight and links below).
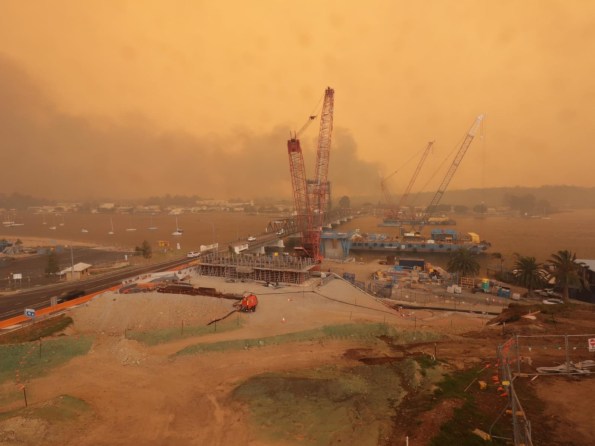
Today a picture from Batemans Bay has made BBC news and is probably one of the headlines you are waking up to this morning. It is difficult to describe the scale and impact of the devastation from the fires.
Currently there is no works on the project site due to the Christmas shut-down. Hopefully the situation will have improved in a weeks time when the site re-opens.
Sadly the fires are like this along most of the coast from the Queensland boarder in the north to parts of East Victoria in the south. All PET students are safe in cities and ready to see in the new year in Australian style.
Wherever you are and however you are celebrating I wish you all a happy new year from Australia.

UK Spec – Sustainable Development
Jambo’s comment on A Blog on Blogging below has actually given me the inspiration for my first blog!
Working over in the ‘freest country on earth’ sustainable development just hasn’t come up as an area to gain experience. In order to be so free Americans avoid Federal Government ‘meddling’ as much as possible leaving it to the states and individual counties, which business then takes advantage of. Examples can be easily found in H&S as well as environmental impacts of how this can cause a race to the bottom in certain areas.
The only time I have seen sustainable development is a tick box form to question if light bulbs meet minimal efficiency standards and if the manufacturer uses sustainable methods where Unknown was an acceptable answer. This form was a requirement as it is a government contract however nobody was interested in the answers, just that the form was complete.
How are others getting on with this competence?
Is sustainable development taken seriously in the UK and Aus, or just individual projects (if at all)?
@bnrbwoods, I expect BP aim to have buzzwords like sustainable development covered off to help with their image? Is this realistically a tough sell?

Merry Christmas and Happy New Year all!
A blog on blogging…
The PET Blog so far for me has been a scary place, full of complex Civil treatises about mud and concrete. So I questioned – what do PEW want from a blog?
Now that I have moved to Phase 3, I’ve discovered a similar concept at Arup. Called ‘Yammer’, it seems to be an avenue for the sharing of short dits that could be useful across multiple project disciplines, or to succinctly frame a problem and ask for advice from across the company. Being a much larger organisation (c.14,000 personnel), the blog is split by discipline/area and includes Project Management, Building Services, Bicycle Users Group etc etc.


Arup blog examples from ‘Yammer’
It has made for some interesting reading and has demonstrated, at least for me, how useful a blog could be as a knowledge sharing device. The short, quick nature of their posts takes little from their day, but the benefit is obvious. I also think that keeping it short promotes involvement from a wider audience. But this is just their way of doing things.
I’d be interested to hear what you guys think about what the PET blog should be – What do we want from it? Is it being used in the best way? How should we be using the blog? Should we set Cheese and Groom a word limit?
Have a good Christmas and NY! Back to the beach…
Geopolymer “Earth Friendly” Concrete
It is well known that the production of Portland cement (OPC) is highly damaging to the natural environment. It is high in embodied carbon and embodied energy and its production creates noxious waste emissions – globally, production of 1 tonne of OPC produces roughly 1 tonne of CO2. Reducing the OPC content of concrete mixes has been standard practice in construction for many years, through the use of cementitious replacement materials such as blast slag (e.g. GGBS) or fly ash (e.g. PFA) derivatives, but an Australian company is now marketing a geopolymer based concrete which contains no OPC at all.

EFC pavement
Wagner’s Earth Friendly Concrete (EFC) uses an alkali chemical powder to activate other pozzolans – cementitious content (GGBS and PFA) – to achieve the binding effect of cement. If you accept that GGBS and PFA are waste materials (which is a separate topic) then EFC can see 80-90% reductions in carbon carbon emissions when compared to a full OPC mix.
Crucially, this product is now able to match concrete in many applications and appears to be commercially viable. The fine and coarse aggregate content remains the same in terms of performance it shows:
- 30% higher flexural strength
- Very low heat of reaction
- Very low shrinkage
- High sulphate resistance
- High chloride ion ingress resistance
- High acid resistance
There are a number of case studies available (wagner.com.au) which show good performance in pre-casting and pavements in particular (including airports) with an interesting foray into sewer tunnel lining. The low reaction heat, leading to low shrinkage, is an ideal characteristic for pavements (especially I imagine in Oz where curing must be tricky in the heat?) and the high resistance to chemical attack makes it a good choice for sewers or other corrosive environments. It even has a clean white finish.

EFC precast
There certainly seems potential for use in the UK in mass concrete applications at least e.g. piling and ground bearing slabs, but I haven’t seen much evidence yet of it’s use for in-situ superstructure pours. I imagine this is a result of the low reaction heat leading to longer curing times (or vice versa at the chemical level). In a concrete frame longer curing means longer shuttering, more back-propping and slower jumps between floors – i.e. it means money – but this doesn’t apply so strongly to unpropped steel decking (composite) slabs so perhaps there is potential there too.
Has anyone seen this in use yet, especially you guys Down Under?
The return of the most expensive cube of grout
Refresher
In my earlier blog on the most expensive cubic metre of grout ever poured I ended with a hope… and a contingency.
Taking core samples from suspect grout
The hope was to take core samples from the suspect grout on the chance that the in-situ strength was higher than the cube test results which had returned compressive strengths of <40MPa after 14 days (less than half the forecast strength at this age). The design consultants had worked around the clock (literally – Robert Bird Group enlisted one of their New Zealand based engineers to work the opposite hours to the UK team) to prove the scheme with a minimum grout strength of 50MPa.
Core Samples
100mm samples were taken where we could get at the face of the grout and clearly showed the separation that we feared.


As you can see in the photos above the grout has separated and the fine aggregates (<2mm sand) have settled to the bottom. The smooth grey upper section contains the majority of the cementitious content and the chalky white crust on top is the synthetic polymer additives. The granular layer was so weak several of the samples sheared in half during extraction revealing the cross-section above.
Testing
The specimens were sent for testing (which by the way takes a lot longer than cube testing due to the time required to prepare and cap the samples) and strength results were issued. We asked for testing of the lower sections of the specimens as this is where the bearing surface is and where we suspected the lowest results.
For the two samples in the left hand photo we received cube equivalent compressive strength results of 17 and 15.2 MPa. On one slightly longer sample we were able to test both the bottom granular section and the upper smooth section. This test returned 37.3MPa in the aggregate and 70.6MPa in the cement matrix. This again supported the theory of complete segregation due to over-watering of the mix.
For anyone coming across a similar situation I have uploaded a document summarising viable In Situ Testing Techniques.
Conclusion
Instruction was issued that all affected grout was to be removed by hydro-demolition and replaced with only a month long window in order to avoid knock-on critical path delays to the project as a whole – a certain contender for the title of world’s most expensive grout.
Can you trust a contractor?!
Just a quick question really guys, have any of you trusted the contractor to work to their own ITP. It might seem strange but during my site attachment the contractors were loathe to follow their own contractually agreed documents. I was just wondering if any of you had any issues?
Failure is sometimes an option
As a cohort we have just moved onto Phase 3. I am in my second week at a temporary works design office for BAM Nuttall. To get myself acquainted with the team and some design work, I have been given checking duty for a number of designs. The one I am posting about is a temporary working platform for a sheet piling operation.
The design is for a platform for a piling rig and crane to both travel and work on. The platform has been split into two requirements a haul road and working platform. The contractor specified they wanted to use bogmats (100mm timber planks) instead of aggregate due to the logistics on site. The working platform was designed with 1 layer of bogmats for the whole and 2 layers under the crane outrigger positions.
The checks are conducted simply by calculating the load and subsequent pressure (depending on contact area) on the tarmac and sub-grade and comparing it with their bearing capacity. If the material fails, a layer of bogmats are placed on top and then a recalculation is done with a layer of bogmats to aid distribution of force and hence lower pressure. In the case of the crane outriggers a second layer was needed as the pressures were still beyond the capacity of the soil. There are load cases and partial safety factors but as it is not important to the blog I will not detail them.
An interesting case was determining whether the tarmac haul road needed bogmats or not. The piling rig passed easily because the travelling load is much lower than that of the working load and the large tracks distribute the load onto the tarmac adequately. The crane, however, with its wheels had a much larger pressure.
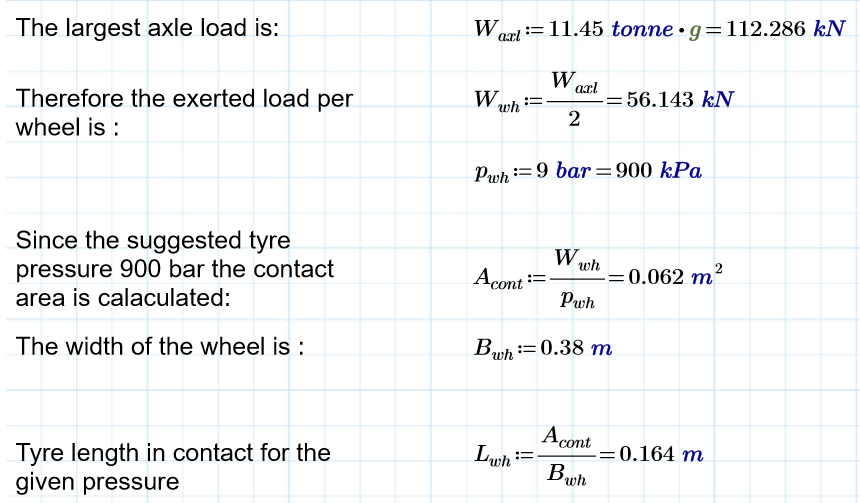
This amounted to a 921 kPa pressure on the ground. To put this in context the piling rig exerted a 70 kPa pressure.
The ultimate bearing capacity of the tarmac was calculated at 411kPa and therefore failed. This was not all as bad as it seems however. The design continues to assume a 50mm deformation of the 150mm tarmac layer. This sinking of the tyre actually provides a larger contact area between the tyre and the ground. This not only gives a smaller pressure due to the same load being distributed over a larger area, but changes the shape factor in the bearing capacity equation giving a better capacity. After re-modelling the bearing pressure reduced to 290kPa and the bearing capacity of the tarmac increased to 870kPa meaning the crane passed.
This seemed like it was riddled with assumptions to me. Firstly, how do we know the tarmac is deforming 50mm? It was not calculated, it was purely an assumption made. Secondly, how do we know this deformation is purely elastic and wont leave the road rutted after use? I took my queries to the senior designer and he stated that considering the crane is a tracked vehicle it will arrive to site on a tarmac road and it can be assumed the tarmac on site is not dramatically different to that on a road and if the tarmac on the road can take it, the risk is low. Also given the crane is just travelling the risks of any serious incidents should the soil fail are also very low. I didn’t like how the capacity of the ground had doubled from 411 kPa to 870 kPa purely by the load being “embedded” into it. These came from a spreadsheet held within BAM which basically just computes the coarse soil bearing capacity equation :
![]()
This to me is “grey-box thinking” where the engineer who initially designed this, did not necessarily know what he was computing, just the inputs required. Ultimately, I might not feel fully comfortable with the results of the spreadsheet, but I am comfortable with the senior designers assurance that the risk of this particular activity, compared to the rest of the working platform is low. A potential risk to be highlighted in the designers risk register and nothing more.
I guess there are ways of meticulously modelling and calculating all of this but the balance of risk and temporary nature of the platform meant these assumptions and risks were tolerable enough to not bother. It is an interesting study on balancing the design risk with the time (and therefore cost to BAM) to reduce it.
Using Dynamic Pile Driving Formulas on Site
I thought I’d post this blog as it is directly relatable to my thesis topic and highlights the risk of ‘boundaries’ regarding geotechnical engineers and pile design.
The marine piling package is well underway on my project, with 5 piles installed to date. I am not overseeing this package (I am focussed on substructure works on the eastern bank of the site) but have been keeping myself up to date with the marine piling QA as my thesis is aimed around pile driving formulas and will use primary data from our pile driving records/CAPWAP analyses.
A few weeks back, one of our piles (P1-P09-PSP-01) was driven to design depth but failed to reach End of Dive (EOD) capacity, recording a set of just 5.1mm per blow at ~280kj of energy. This pile is an open-ended steel tube with a diameter of 1600mm, pile wall thickness of 25mm and pile shoe of 1m long by 50mm wall thickness. It is designed to carry a geotechnical design load of 21MN.
Piles have been driven using an IHC S280 hammer, and was initially driven with Pile Driving Analyser (PDA) equipment to a penetration of 21.77m (-32.36m RL). The PDA EOD indicated that the pile had an inadequate resistance at this depth. The PDA equipment had to be removed due to the risk of water damage (i.e. the gauges were at risk of being submerged in the River). A CAPWAP analysis was carried out on one of the final blows at this stage of re-driving, also proving inadequate capacity.
Though both a borehole was taken at each pier location and the pile itself was fabricated with an extra 2m length to mitigate risk of failing to reach capacity at design RL, this situation highlights the risk of certainty in geotechnical boundaries.
The pile was driven further without PDA monitoring and the set was monitored using survey. The pile was driven to a final toe level of -32.8m RL. The final set achieved was 1.6mm (per blow) at maximum hammer energy (~280 kJ). This was positive, suggesting the basalt rock layer had been established.
For the project to date, PDA testing and CAPWAP analysis have been undertaken on all previous marine piles to confirm capacity. This has enabled correlations to be developed to PDA/CAPWAP to pile installation parameters (i.e. you can use sets achieved on previous piles to estimate pile capacity). As no PDA equipment was attached for the final driving of the pile (and thus no possibility of CAPWAP analysis), an alternate approach to pile capacity verification was required.
Without going into too much detail, hundreds of dynamic pile driving formulas have been derived since the mid to late 1800s. In Victoria, the Hiley Formula is referenced for use in VicRoads publications, which is dated and requires input of several parameters. One such input is the Temporary Compression (TC) measurement of the pile (effectively the energy lost during hammer impact due to elastic compression in the pile, soil and cap). TC energy losses are on of two types on losses experienced, the other be Newtonian Impact Theory (effectively a coefficient of restitution that is used to indicate how much of the original kinetic energy remains after the impact of two objects)
TC could not able to be recorded onsite due to the difficulty obtaining this measurement due to the pile becoming submerged and the hammer sleeve ‘covering’ the top of pile. This prevented the Pile Driving Monitor (PDM) from being used to record TC.
Therefore, the geotechnical engineers required use of a pile driving formula that does not incorporate TC. Stringent rules allow for this and is only considered appropriate in cases where:
-
- There is a high proportion of piles subjected to PDA/CAPWAP;
- Hammer energy measurement is undertaken to confirm hammer performance;
- There is a high level of engineering supervision and the standard of piling QA is high.
These requirements were considered met so the geotechnical engineers decided that the ‘Gates Pile Driving’ Formula (developed in 1957) would be used to allow estimation of pile resistance. The Gates Formula is as follows:
𝐺𝑎𝑡𝑒𝑠 𝑅𝑒𝑠𝑖𝑠𝑡𝑎𝑛𝑐𝑒 𝐹𝑎𝑐𝑡𝑜𝑟 = 27 ∗ √𝑒ℎ ∗ 𝐸 ∗ (1 − 𝑙𝑜𝑔10 (s/25.4))
where: s is set in mm
eh is hammer efficiency (assessed as efficiency of energy transfer to the pile from PDA measurements on other representative piles)
E is the hammer energy delivered to the pile.
As the Gates Formula was developed in US units (i.e. kips, ft) the formula does not result in a resistance in metric units (i.e. kN). To avoid the need to convert all units to US and redefine the constants in the equation, the Gates Formula was used to evaluate a ‘Gates Resistance Factor’ which is proportional to the estimated resistance. Importantly, this is subsequently correlated to CAPWAP resistance.
A correlation factor is necessary between the GRF and the PDA/CAPWAP capacities determined from analysis on representative tested piles (i.e. piles already installed). This correction factor is termed Gates Correction Factor (GCF) and is calculated as:
𝐺𝐶𝐹 = CAPWAP Resistance / 𝐺𝑅𝐹
|
Test No. |
Toe Level (Test) | Pile Penetration (Test) |
Driving Stroke |
EOD
Driving Set |
Driving TC |
Test Type |
Test Set |
EMX |
RMX |
Potential Energy |
Hammer Efficiency |
| – | m RL | m | mm | mm | mm | – | mm | kN- m | kN | kN-m | – |
| C1-P03- PSP-03 EOD |
-31.53 |
19.33 |
2040 |
0.50 |
13.90 |
EOD |
0.5 |
248 |
33529 |
280.2 |
88% |
| C1-P03- PSP-04 EOD |
-32.45 |
15.65 |
1600 |
1.40 |
12.60 |
EOD |
1.4 |
218 |
28303 |
219.7 |
99% |
| C1-P03- PSP-04 RST | -32.45 | 15.65 | 1700 | 1.40 | 12.60 | RST | 0.7 | 228 | 29517 | 233.5 | 98% |
| C1-P03- PSP-04 RDV |
-32.45 |
15.65 |
2040 |
1.40 |
12.60 |
RDV |
1 |
269 |
32231 |
280.2 |
96% |
| C1-P03- PSP-02 EOD |
-35.10 |
13.00 |
1600 |
2.30 |
11.70 |
EOD |
2.3 |
207 |
19863 |
219.7 |
94% |
| C1-P03- PSP-02 RST | -35.10 | 14.50 | 2040 | 2.30 | 11.70 | RST | 1.3 | 269 | 25067 | 280.2 | 96% |
| C1-P03- PSP-01 EOD |
-35.07 |
13.20 |
1455 |
2.80 |
10.20 |
EOD |
2.8 |
191 |
18827 |
199.8 |
96% |
| C1-P03- PSP-01 RST | -35.07 | 14.30 | 2040 | 2.80 | 10.20 | RST | 1.7 | 270 | 24708 | 280.2 | 97% |
| P1-P09- PSP-01 RDV |
-32.36 |
21.77 |
2040 |
5.10 |
– |
RDV |
5.1 |
276 |
22475 |
280.2 |
98% |
The table above demonstrates the results of the testing conducted (EOD and CAPWAP) on the 4 previously installed piles for correlation for Gates. The table below shows the pile resistance factor values calculated from the Gates Formula, as well as capacity evaluated from CAPWAP and the GCF.
For all tests (excluding Pile C1-P03-PSP-03 EOD which is considered unrepresentative) the energy efficiency ranged from 94 to 99% (an important parameter for formula input), with an average of 96.8. A Lower Bound efficiency of 94% was adopted in estimating resistance for pile P1-P09-PSP-01.
|
Test No. |
Gates Resistance Factor |
CAPWAP Compressive Capacity |
GCF |
| – | – | (kN) | |
| C1-P03-PSP-03 EOD | 1149 | 33500 | 29.1 |
| C1-P03-PSP-04 EOD | 900 | 25555 | 28.4 |
| C1-P03-PSP-04 RST | 1044 | 29570 | 28.3 |
| C1-P03-PSP-04 RDV | 1065 | 32280 | 30.3 |
| C1-P03-PSP-02 EOD | 792 | 19700 | 24.8 |
| C1-P03-PSP-02 RST | 1014 | 25080 | 24.7 |
| C1-P03-PSP-01 EOD | 730 | 18790 | 25.7 |
| C1-P03-PSP-01 RST | 966 | 24670 | 25.6 |
| P1-P09-PSP-01 RDV | 761 | 22315 | 29.3 |
The Gates resistance values are generally seen as lower than the CAPWAP resistances with GCF values from 24.8 to 30.3. These are plotted against pile set below to provide a line of best fit of pile set against the Gate Factor. Using this and the set obtained at EOD (1.6mm) for pile P1-P09-PSP-01, the GCF equates to ~27.
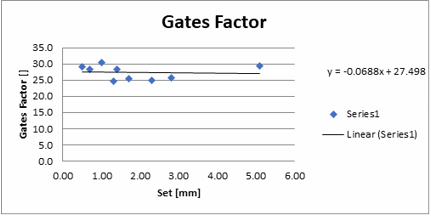
Using the below parameters, The Gates Pile Driving Formula estimates a resistance of 26,173kN at end of redrive.
Set = 1.6mm
Hammer Energy = 280kJ (IHC S280) Hammer Efficiency = 94% (LB)
Gates Correlation Factor = 27
This is well above the required capacity of the pile (~21MN) and is therefore considered competent. In addition to this, the previous piles have demonstrated a ‘set up’ (refer to my previous post) of 15%-31% increase over 24 hours (minimum required time between EOD and Restrike Test (RST)) – See table below. This suggests further assurance to capacity and thus QA of the pile.
|
Test No. |
Compression Shaft Resistance |
Toe Resistance |
Compression Capacity |
Toe Level (Test) |
Shaft capacity improvement (%) |
Overall Capacity Improvement (%) |
| kN | kN | kN | mRL | |||
| C1-P03-PSP-04 EOD | 8055 | 17500 | 25555 | -32.450 |
146% |
115% |
| C1-P03-PSP-04 RST | 11770 | 17800 | 29570 | -32.450 | ||
| C1-P03-PSP-01 EOD | 7390 | 11400 | 18790 | -35.070 |
161% |
131% |
| C1-P03-PSP-01 RST | 11970 | 12700 | 24670 | -35.070 | ||
| C1-P03-PSP-02 EOD | 7700 | 12000 | 19700 | -35.100 |
150% |
127% |
| C1-P03-PSP-02 RST | 11580 | 13500 | 25080 | -35.100 | ||
| P1-P09-PSP-01 RDV | 9765 | 12550 | 22315 | -32.363 |
152% |
124% |
| Average | ||||||
The use of the Gates Formula on site to assure capacity of this pile has been, coincidently, very useful for my Thesis and demonstrates alternate methods of assuring quality. The importance appears to be in the ability to both/either accurately measure parameters/input data on site and correlate results with a data set. Without having yet asked, I wonder what the solution might have been had this been the first pile? Maybe install further piles and hope to achieve resistance and use the parameters obtained to correlate as was in this case? Or would they have bit the bullet and spliced the pile on site – rather tricky being in a marine environment from a barge, especially given the high QA regime and Workplace Health & Safety controls?
The most expensive cubic metre of grout?
The Plan
The casting of the column bases into the pile heads is one of the key early stages in my project. To (try to) ensure the quality of this operation a carefully staged process was developed with hold points and hand over inspections involving the concrete and steel sub-contractors, the principle contractor and the designer.

Design build up beneath the base plate within the pile casing
To leave space for the steel shear keys beneath the base plates the pile concrete cut-off level was left short of the top of the casing. The process for installing the base plates became a 6 stage operation as follows:
- Prepare the pile head as handed over by scabbling the surface and extending the rebar cage where required. Pour C70/85 concrete to achieve desired pile level, ~50mm below the bottom of the shear key.
- Install a 10mm steel levelling plate.
- Grout beneath the levelling plate using a high strength (100MPa) ‘non-shrink’ grout.
- Install the main baseplate with shear key and temporary works.
- Pour C70/85 concrete to within 100mm of the bottom of base plate.
- Pour high strength grout (100MPa) beneath the bearing surface of the base plate (max 100mm thickness) and up the sides to top of steel. Grout was specified to ensure full dispersal of the mix beneath the plate to ensure full contact with the bearing surface to satisfy the design bearing pressures from the column into the pile.
All stages had gone as planned until the final (and most important) stage.
The Execution
Unfortunately, our ‘specialist’ sub-sub-contractors clearly didn’t get the memo (or any training in mixing grout it seems). While mixing the bagged grout on site they ignored quality procedures and, following a mechanical failure with the volumetric doser, ended up adding water to the mix using the ever accurate bucket method.
The result is unlikely to surprise anyone. The grout was considerably over watered and separated in the pile casing. The cementitious content has fallen to the bottom topped by a layer of polymer additives, all submerged under 90 mm of bleed water.
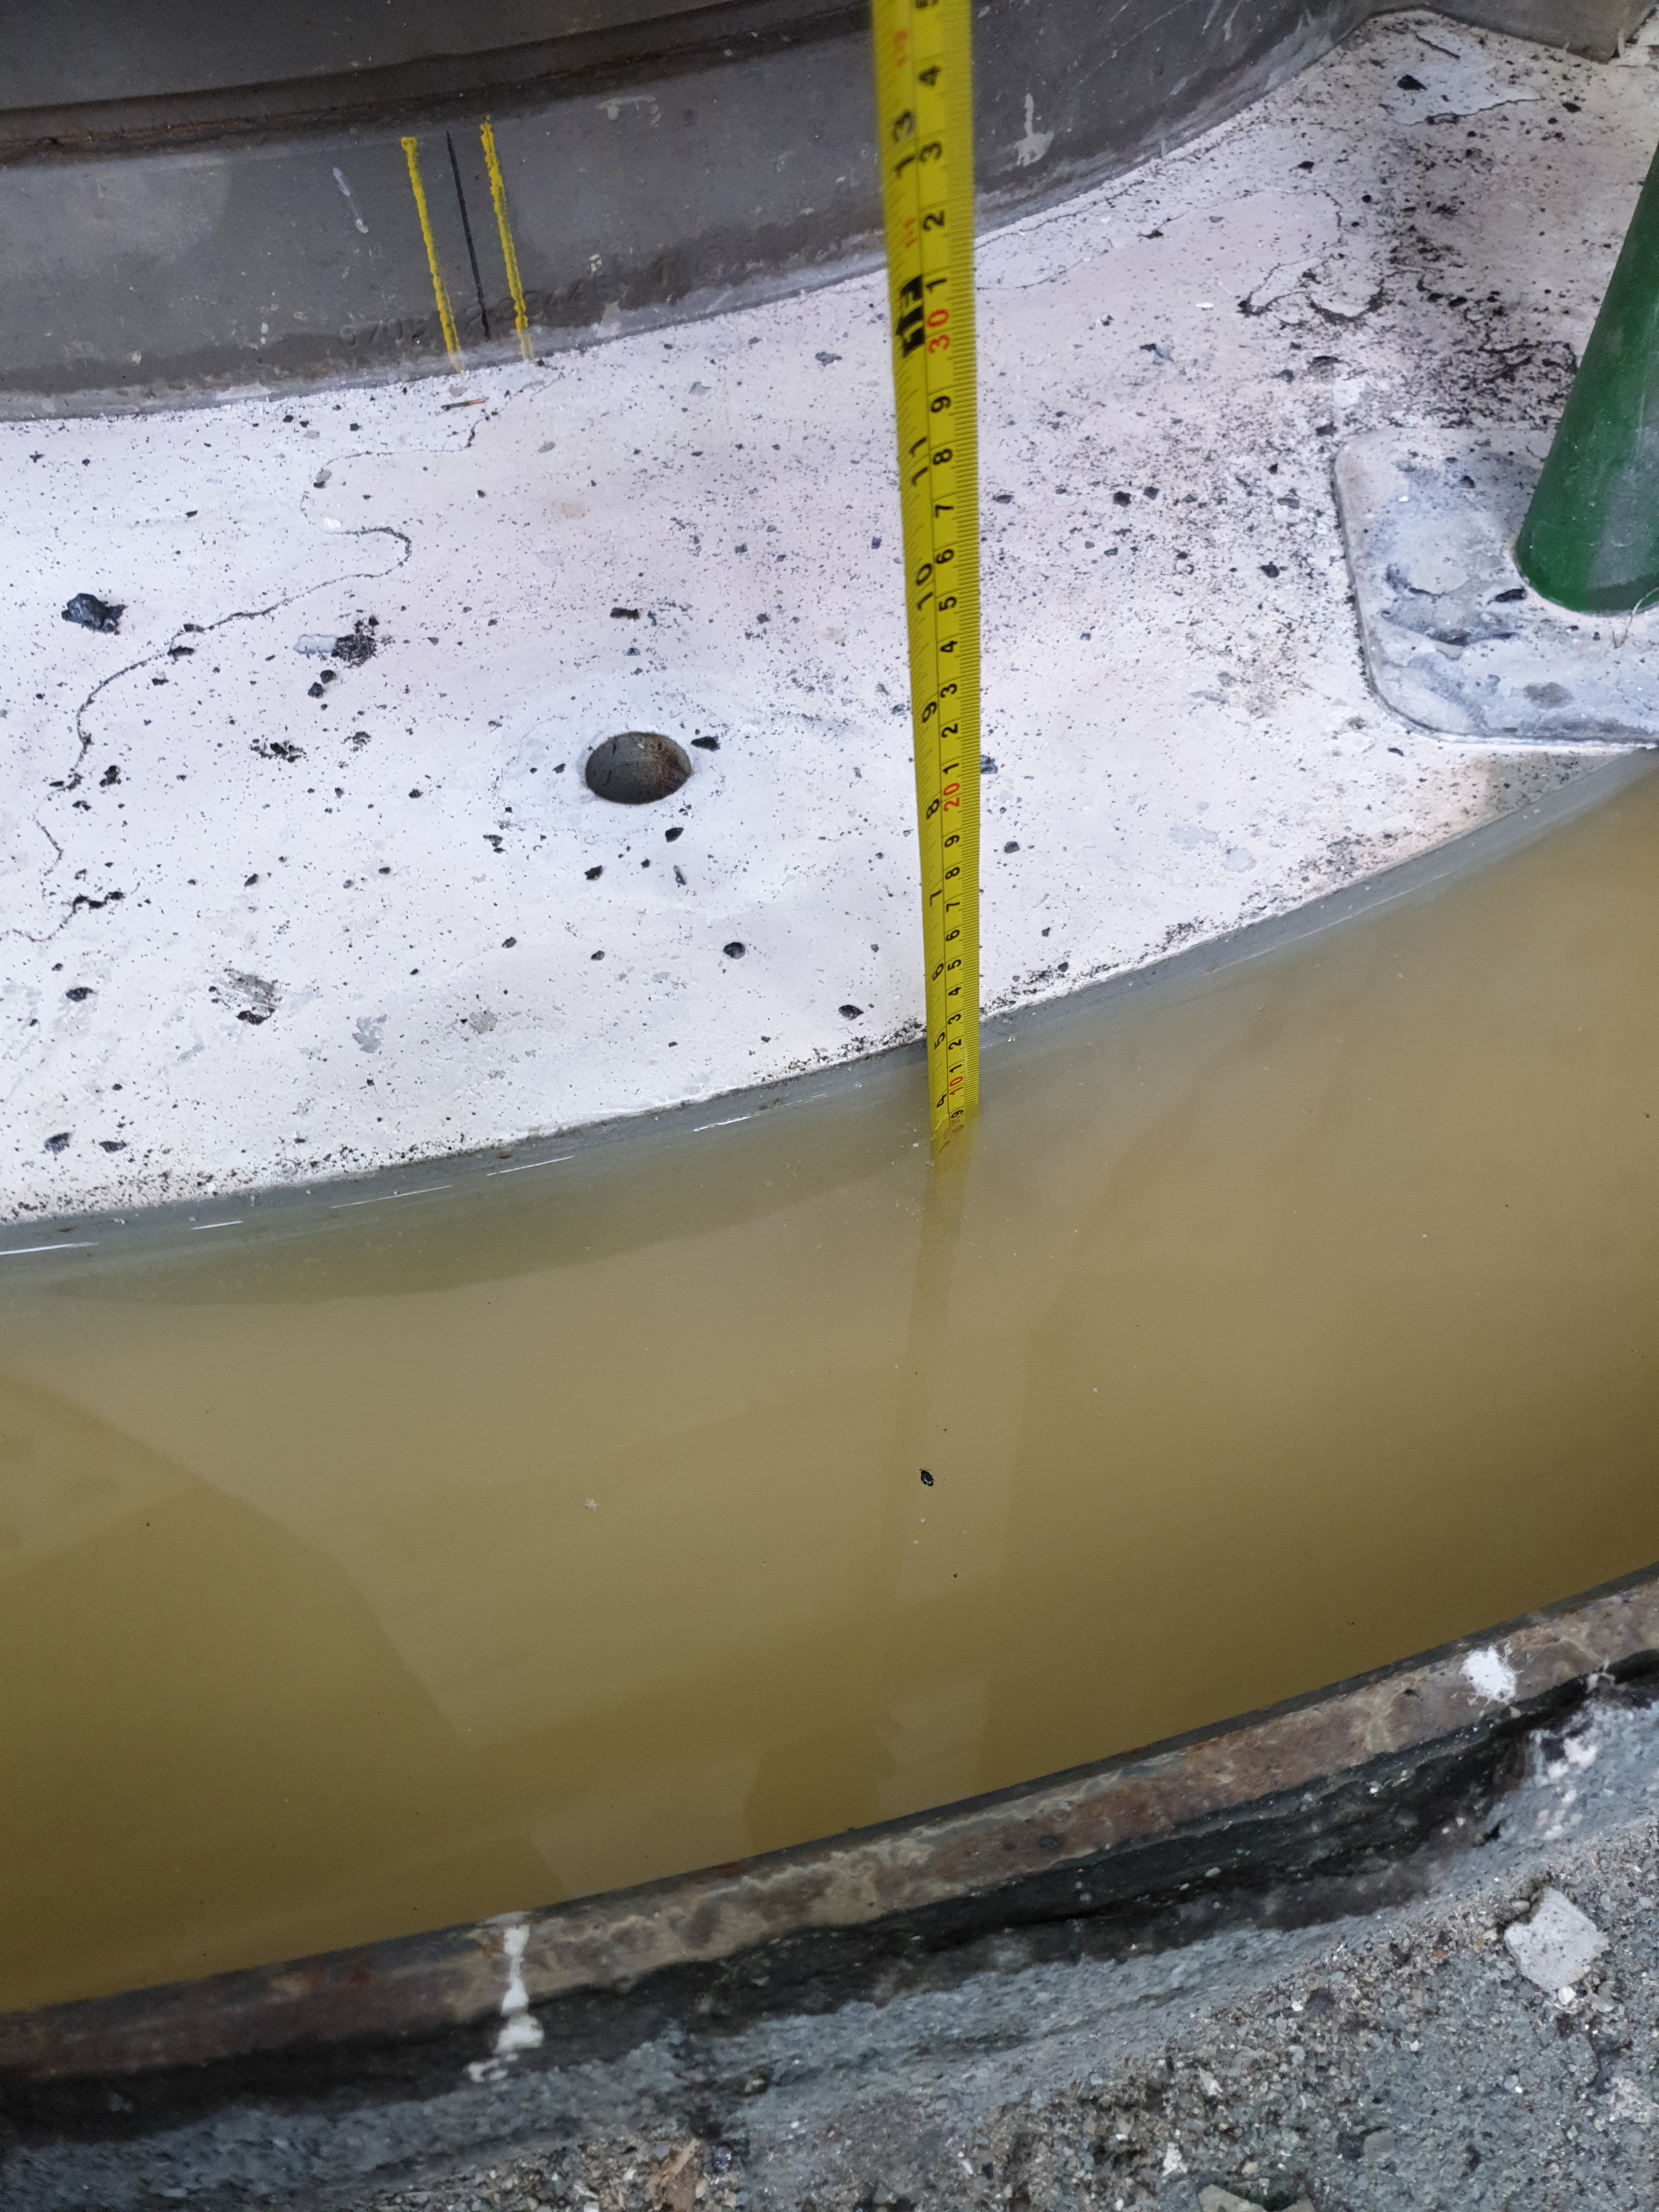
Bleed water from the separated grout pour
There were immediate concerns over the strength of this grout layer and the 7-day cube result shows 39.1 MPa against a forecast compressive strength at this age of 75 MPa and a design target strength (28 day) of 85 MPa. This raises all the usual issues with failed quality tests but owing to the criticality of this bearing surface a remediation plan must be put in place within the month. Any longer than that and the designers cannot guarantee the structure for further steel erection – all of which is on the critical path.
With no float left in the programme following delays elsewhere (see my earlier blog on off-site programme) any critical delay to the programme will incur damages and costs totalling close to £1M per week.
So what are the options?
The Hope
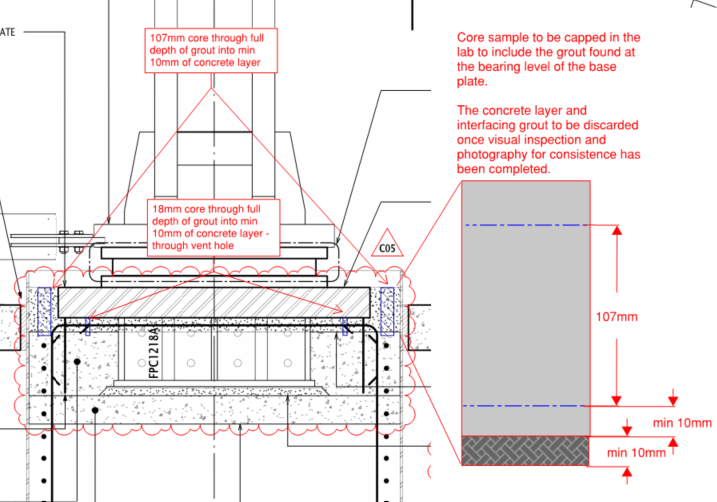
Owing to the cause of this non-conformance (over-watering) there is no confidence that the cube result represents the in situ condition so additional testing is required. We will also take smaller core samples through the base plate’s vent holes to ascertain the profile of the grout across the bearing surface (see below).
I have uploaded an In Situ Testing Techniques guide from one of our sub-contractors for interest but for this problem we are taking simple core samples for compressive strength testing (BS EN 12504).
Core locations in failed grout layer
The hope is that a core can return a result approaching 50MPa and that the design engineer can justify this reduction in strength from the design. I suspect this is highly unlikely on both counts so what is the fall back?
The Contingency
The only fall back is to remove the grout but the access is extremely difficult. The current proposal is for hydro demolition with a curved lance to access the gap between the casing and the base plate. This is currently under review but adjusting the power of the lance should allow for the removal of the weak grout without damaging the concrete of steel beneath.
This requires considerable planning effort and time to execute. This will be followed by installing the grout again properly. And the clock is ticking before damages begin.
Lessons Identified
- A specialist is not necessarily any more competent than any one else in any given task.
- Adding water to concrete/grout, beyond mix design, is a bad idea.
- Paying to do the job right the first time is cheaper than rectifying mistakes if they happen.
- It doesn’t take long for a simple task to slip onto the critical path.
Temporary works design – MEWPs
General. I have been reviewing the temporary works design that we have received on site for the use of some MEWPs on our suspended slabs. Two different MEWPs are to be used, one at approx 35.9 kN when loaded with a small footprint (1.25×2.22m) and a larger version, 69.3 kN when loaded with a footprint of 2.27×5.47m. The maximum slab span in the working area, is a two way spanning 9.48×6.4m with a qk of 5.95 kN/m2 and 6.9 kN/m2 in the smaller area shown below.

Temporary works designer (TWD) assumptions
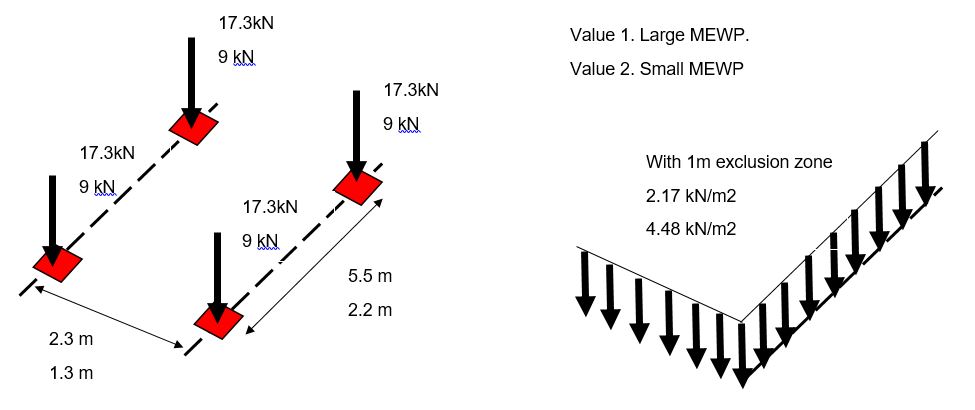
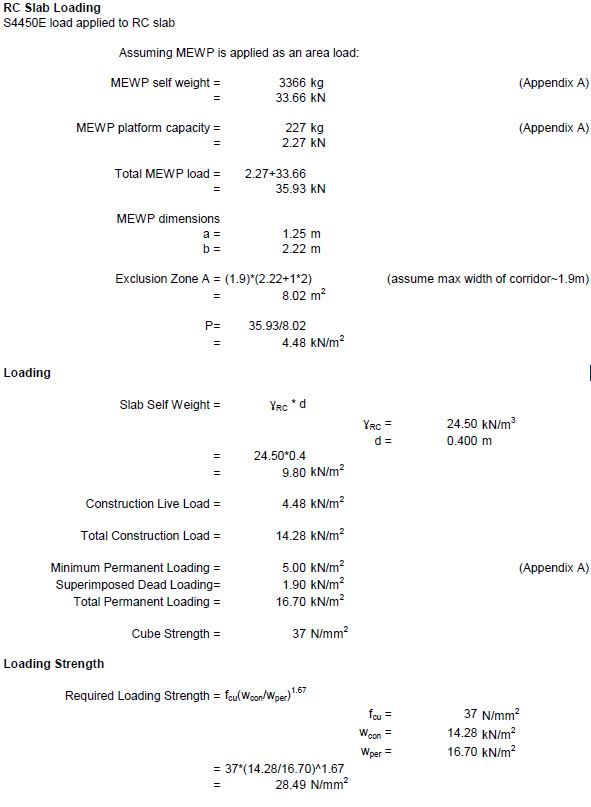
Method. I initially did some conservative calculations applying the combined load of two wheels at the mid span compared against the design UDL to check the TWDs value. The temporary works designer however has applied the MEWP as an area load with the addition of a 1m exclusion zone around each one. They then verify that this is less than the permanent loading before stating the loading strength required of the concrete. Note the loading strength is not a concern as the slabs have reached their permanent strength.

Limitation. An exclusion zone is normal around a MEWP however as work progresses equipment and furniture may already have been installed and so the surrounding area may not be completely clear. Also note the smaller MEWP must work in a corridor so a smaller exclusion zone has been included above.

TWD summary
Question. Is it appropriate to apply a vehicle load as a UDL in this way (this reminds me of the UDLs/tandem systems we used in bridge design)? Should alternative load models have also have been used to check this was the most onerous version?
