Archive
Pre-stressed concrete canopy analysis and design verification. Destined to fail?!
My current task on site is the construction of four pre-stressed concrete canopies (locations in fig 1 below). At first I wasn’t expecting any engineering challenges; however, they have offered some valuable experience in first principle analysis, contracts, building techniques and safety in design (AUS equivalent of CDM).

Figure 1 – Location of four pre-stressed concrete canopies to be constructed.
The Canopy Structure and load path.
All canopies will be constructed in-situ and off formwork to a class 2 finish as specified by the Architect. The canopy slab is reinforced concrete with post tensioning tendons running between the columns. At the edge of each slab, on the tip of the cantilever, is an architectural trim that weighs an additional 1.5 tons. The columns are also reinforced concrete and transfer the loads through to a reinforced concrete pad footing. The loads are then transferred into the ground using helical/screw piles which have already been constructed. A plan view of Canopy 01 can be seen in figure 2 and a typical section through the canopy can be seen in figure 3.

Figure 2 – Plan view of Canopy 01.

Figure 3 – Typical section through the pre-stressed canopy. Radial line to be used for analysis.
Contractual Arrangements
The Roundhouse project and the Science and Engineering Building (SEB) Project have been executed under two different contracts. The SEB has been procured under a Design and Construct (D&C) contract, whereas the Roundhouse is part of a two stage Managing Contractor (MC) contract. The first stage of this contract was for the Roundhouse works and the second stage is for the external landscaping, referred to as the Public Domain works. Whilst the MC contract means that the principle has final authority on all design decisions and appointments of subcontractors, the second stage is still in the Early Contractor Involvement (ECI) stage, where MPX are essentially coordinating the design process, without carrying any liability for the final design. Stage 1 of the contract is essentially a traditional construct only, where the 100% detailed design was provided by the principle and the principal’s consultants. Therefore, MPX have no liability for the design and only review the drawings on a buildability basis. However, when there are concerns over the design, a request for information (RFI) can be raised to seek further approval of design.
The Issues
1. The structural consultant’s scope included the design of all elements apart from the screw piles, which were specified by the groundworks subcontractor’s (FCC) specialist consultant; Helcon Contracting Australia.
2. Concerns over the working loads created by the cantilevered slab on the foundation piles, including the impact of the stainless steel trims. The stainless steel trims were an architectural design variation and were not included in the structural consultant’s original calculations. The working loads specified by the structural consultant were 350 KN (SP2 – Compression pile) and 175KN (SP3 Tension pile) as shown in figure 4.
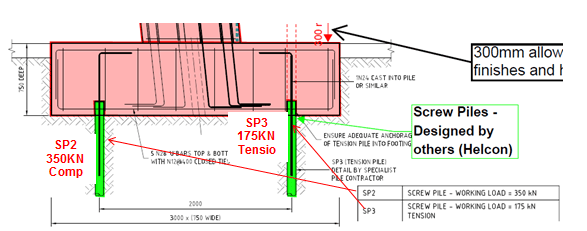
Figure 4 – Detailed section through canopy footing. 2 screw piles are designed to deal with moment created by the cantilever. Working loads specified by structural consultant shown.
3. No pile design calculations were received by MPX from Helcon for the screw piles. Helcon only specified the section geometry. Torque and depth readings were submitted as part of the inspection and testing plan (ITP) during construction, which Helcon used to produce a certificate of compliance. My primary concern was the depth of the screw piles. The site record shows that the depths were taken from ground level; however, the actual length of pile in the ground would be much less as illustrated in figure 4. After the footings have been constructed, the actual length of pile in the ground would be reduced to 3.35 metres.
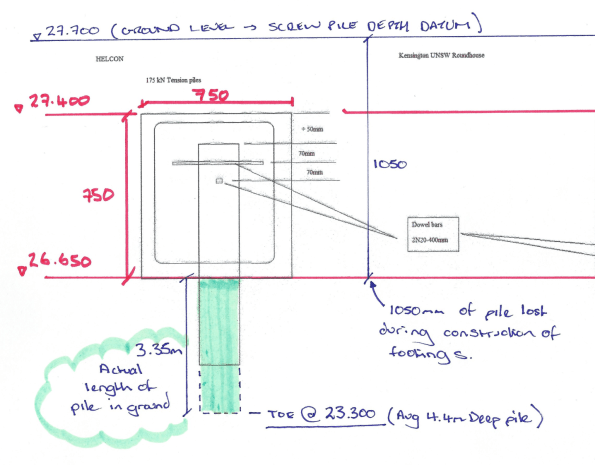
Figure 5 – RLs (AHD) for footing and pile depths. Screw pile records were taken from existing ground level.
Analysis (simple radial slice through the structure).
My aim was to ultimately determine if the structure would stand up! In order to do so, I did the following:
1. Analysis of the cantilever slab in order to calculate the maximum possible moment and axial load transmitted into the columns. The working loads in the screw piles could then be determined with a simple FBD.
2. Complete design verification of the screw piles by calculating the ultimate capacity and also determine theoretical ultimate capacity based on torque readings taken on site.
3. Compare working load vs ultimate capacity.
In order to determine the maximum moment created by the cantilever slab, I assumed that all loads from the slab are transferred to a column strip that will be modelled as a concrete beam. The middle column will be the worst case for Canopy 1 as shown in figure 6; the orange area indicates the section of slab that will be transferred to the beam strip highlighted in pink.

Figure 6 – Area of slab assumed to be transferred to notional beam highlighted in pink.
Design UDL = 83 KN/m (plus 6 KN PL at end of cantilever)
Cantilever slab analysis determined that the axial load in the column is 500 KN and the balance of the bending moment transferred to head of column is 487 KNm. The stainless steel trim only creates 5 percent of the total moment created (24KNm) and therefore its additional load is not overly critical.
Therefore:
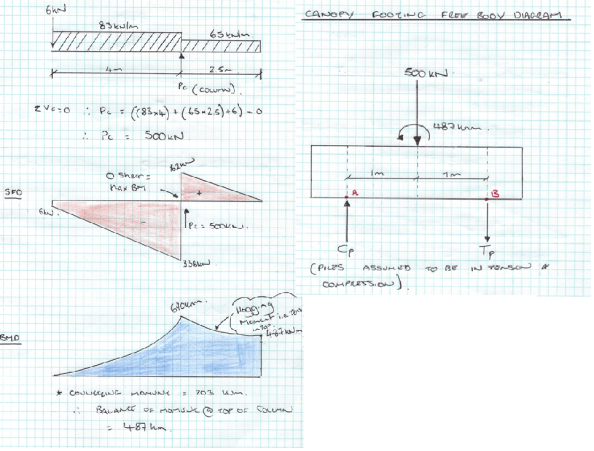
Figure 7 – Cantilever slab analysis and FBD for base of footing.
∑M @ A = 0 Therefore, (500 x 1) – 487 + (Tp x 2) = 0
SP3 = 6.5 KN (Compression)
∑V = 0 Therefore, Cp + 6.5 – 500
SP2 = 494 KN (Compression) > 350 KN
! WORKING LOADS GREATER THAN SPECIFIED BY STRUCTURAL CONSULTANT!
Screw pile estimate of ultimate design capacity.
The screw piles installed for the concrete canopy footings only have a single helix of 350 mm in diameter and the shaft diameter is 114 mm. An illustration of the screw piles used for the canopy footings can be seen in figure 8 below.

Figure 8 – Geometry of screw pile used for footings. Single helix at the toe of the pile.
Compression capacity (SP2 piles)
The ultimate compression capacities of the piles were obtained using effective stress analysis as follows:
Qult = AH (σv’ x Nq + 0.5 x y’ x B x Ny’)
where:
AH = Surface area of helical base plate
σv’ = vertical effective stress at the level of the helix/toe (D) = y’ x Depth.
Nq and Ny = bearing capacity factors
B = diameter of helical plate
y’ = effective unit weight of soil
GWL below toe of pile, so pore pressures assumed to be zero.
Therefore,
Nq (VD Sand φ’ = 37) = 40
Ny = 62
AH = π x r² = 96200 mm² (0.096 m²)
σv’ = σ – u = (16 x 0.65) + (17 x 1) + (18 x 1) + (19 x 0.7) – u (o – no pore pressure) = 57.7 KN/m²
B = 0.35 m
y’ = 19 KN/m³
Qult = 0.096 ((58 x 40) + (0.5 x 19 x 0.35 x 62))
= 0.096 (2320 + 206)
= 242 KN in compression < 350 KN Specified & < 494 KN working load calculated (FAIL)
If, full depth pile from ground level as recorded in ITP i.e. pile is 4.5 m in full length.
σv’ = 76 KN/m²
then Q ult = 0.096 (3040 +206)
= 311 KN < 350 KN Specified 494 KN working load calculated (Still FAIL)
(Shaft resistance ignored as it contributes very little to the ultimate capacity).
Screw pile capacity based on torque readings
The torque readings taken during installation appear to be the only basis for confirming the design capacity of the screw piles. In short, capacity of pile based on torque reading is:
Qult = kt x T (Kt = Torque correlation factor)
= 18 X 20000 = 360 KN > 350 KN specified working load (OK)
< 494 KN working loads calculated (FAIL)
Summary
Maximum working load from radial slice analysis 494 KN (Compression)
Maximum working load specified by Structural Engineer 350 KN (Compression)
Maximum Compression Capacity of screw pile 311 KN (FAIL)
Compression capacity of pile based on torque 360 KN (FAIL)
Questions for the group
By modelling the structure as a simple slice on a radial line, my calculations suggest that the structure will fail!
My working loads greatly exceed the structural engineer’s estimates and the capacities calculated. I think that my analysis is the extreme upper bound model and loads could be overestimated? Am I missing something on this one?
Although the capacities of the pile based on torque and effective stress analysis are relatively close, by only assuming that the top of the helix is providing resistance, I suspect that my calculation of screw pile capacity is underestimated.
BP – Glen Lyon flow transmitters
Just thought I’d provide a quick update on a piece of work I’ve been doing recently on the brand new Glen Lyon floating (is a ship), production (includes an oil rig), storage (capacity 850,000 barrels) and offloading (requires tanker to come alongside), or FPSO for short.
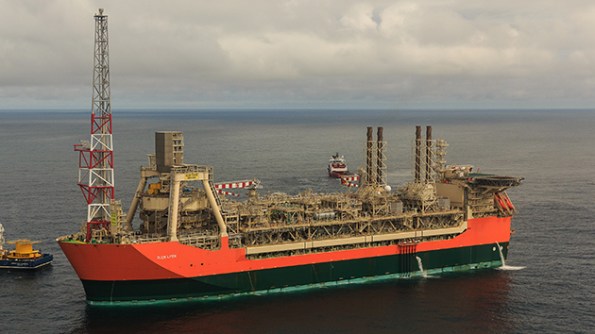
Glen Lyon FPSO
I have been drafted into the Operations engineering team to project manage an issue which happened last week. This issue relates to the gas turbines (GT), of which there are 4, and the Waste Heat Recovery Unit (WHRU), one per GT. A brief synopsis is as follows:
At approximately 1500 on Friday 27th of October, whilst producing circa 100 mboed (1000 barrels of oil equivalent) and during stable operation, a shutdown signal was sent from GT2’s WHRU flow transmitter, initiating a GT2 shutdown. This resulted in a number of cascade trips that eventually caused a production shutdown due to complete loss of FPSO main power (a separate issue currently under investigation).
On initial investigation it has become apparent that GT1, GT2 and GT3s WHRU flow transmitters have all degraded and began to physically leak externally at approximately 50-60 drips per minute. The subsequent failures discovered over the W/E of 28th – 29th October have left Glen Lyon with only 1oo4 GTs availability and unable to ramp up production as a result of the failure.
This is clearly super bad for BP’s flagship asset, which is one of its highest produces. This clearly attracted a lot of attentions from VPs etc. I became involved at the request of the asset for support to project manage the recovery of the WHRUs and the switch over to main power. The immediate issue was the recovery of at least 2oo4 GTs which are required to provide power to the main thrusters to provide stability during an offload to a fuel tanker. By delaying the offload there is a deferral in potential income for the oil that is not being exported. The issue was compounded when a potential procedural issue caused the bursting disks to rupture on the cooling medium system on the only working GT.
Before I describe the options available I’ll explain the flow transmitter layout. Each WHRU has 1 flow transmitter which consists of 16 off transducers which are circumferentially mounted on a 10”pipe (providing 16 potential leak paths). See photo for what these physically look like.


The immediate short term fix was to drain the system, remove the transducers and plug with a standard bolt (short plug) and dowty washer arrangement (see photo). This was the quickest, but the most temporary option available. This was completed for GT3 on 2nd November.
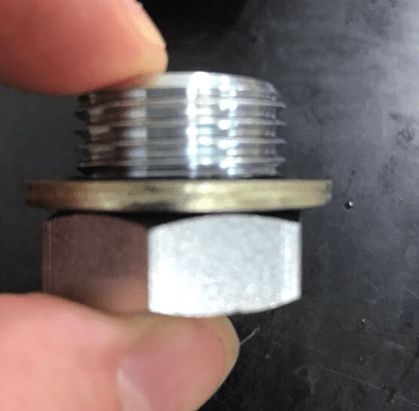
Short plug and dowty washer
The second, and preferred option, is to machine new housings from solid 316L stainless steel, using the dimensions from the original transducer manufacturer. These were expedited for GT2 but failed to fit due to a ‘tolerance’ issue (they were within tolerance so we think they might have messed them up!!). We then had to revert back to using the short plug option which was completed 4th November. This allowed us to run up 2 off GTs on diesel and offload c.200000 barrels to the tanker. The problem with using the short plugs is that they notionally have 2 week expiration on their suitability, which will then need to be changed out for another option. At the present time the machined housings have been re-machined and sent offshore on air freight. The plan is to plug GT1 and GT4 with these.
As a further contingency, 4 off pipe spools have been manufactured which will replace the flow meters and remove the risk of any leak paths. These spools had a lead time of 10 days but will require to be shipped by boat. The current weather is causing issues with offloading as it is a boat to boat lift. These are likely to be offshore next week.
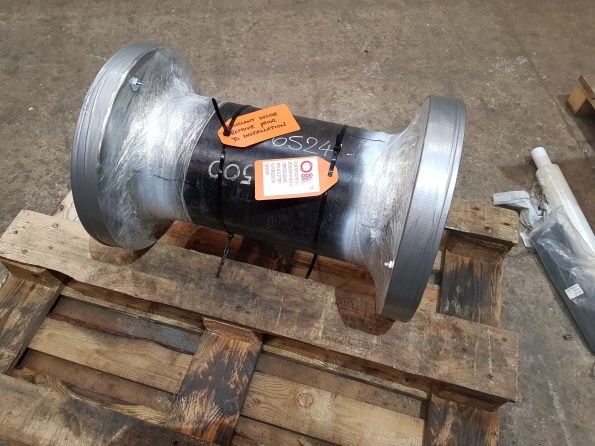
Pipe spool – 600m length c.125kg – must be shipped by boat
The initial headlines have died down somewhat since the main power is back on, the offload was successful and the plant can begin to ramp up production. It has been an interesting experience to be involved in crisis (project) management. The way forward now is to conduct a root cause failure analysis on the transducers to provide a long term solution. Depending on the time required for this, the immediate plugging solution will require change-out for an intermediate solution, likely the pipe spools. I’m likely to be involved in this for the next few weeks at least, with a business call made on my other projects to put them on hold.
Inadequate Toe Bearing in Permanent Cased Bored Piles
Since June 2016, one of my tasks has been to track progress for the solution to the bearing capacity issue faced on the Rail Bridge cast-in-situ permanent cased bored piles. The testing methodologies to find a solution have given me experience in a full repertoire of sequential testing procedures. Bit of a lengthy blog but gives a good insight into pile testing. I would be interested to see whether you would take the side of the sub-contractor or the client?
Background
The new Rail Bridge through the Airport East site is supported by 6 large diameter permanent cased piles, P1 and P2 are 1200mm dia supporting Abutment A, P5 and P6 are 1200mm dia supporting Abutment B and P3 and P4 are 2500mm dia at the central pier, refer Figure 1 below. All the piles are designed in toe bearing alone and have 500mm rock sockets within Class IV sandstone.
The SLS design axial load for the abutment piles is 7.4 MN. For analyses of high-strain dynamic tests, this value was increased to 9.0 MN to account for potential future negative skin friction on the piles. The ULS design axial load for the abutment piles is 10 MN. With a geotechnical strength reduction factor of 0.52 applied, a design ultimate geotechnical strength of 19.2 MN is required (= 10 MN / 0.52).

Figure 1 – Plan view of Rail Bridge pile layout
Concerns over the fractured sandstone allowing groundwater to seep into the piles required a wet tremie pour to be adopted. Following the completion of steel casing installation (Figure 2) and following excavation, water was pumped into the casing up to the water table level to maintain positive head prior to the concrete pour. The positive head aimed to reduce the in flow of sediment from ground water flow.

Figure 2 – Permanent casing being driven during an airport possession, note the railway line has been slewed to allow for works.
Sonic logging tubes were attached to the reinforcement cages, these were kept 200mm off the base of the reinforcement cage, 300mm from the toe of the pile.
During installation of P3 and P4, the 2500mm dia piles, the 16mm thick permanent casing buckled, resulting in a bespoke reinforcement cage being required.
Prior to the concrete pours the reinforcement cage was removed from the hole to allow the base to be cleaned. The piling rig using a cleaning bucket removed any loose material at the pile base. This also agitated any sediment causing it to go into suspension prior to the pour.
The tremie was lowered below the water line to the base of the pile. As the level of the concrete in the pile increased the tremie pipe was withdrawn in sections ensuring that a minimum immersion of 2-3m of the tremie pipe remained in the concrete at all times.
Pile Testing
Cross-hole sonic logging (CSL) was used to assess the integrity of the piles. A primary advantage of CSL is that it can assess the integrity of piles at depths which may be beyond the capabilities of sonic echo testing. It is probable that a large number of piles will include defects of some sort. The important consideration is that these defects will not materially affect the structural performance of the pile. The CSL assessment detected 15 issues of ‘Poor/Defect’ anomalies at a depth of approximately 35.6m – 36.1m below the top of concrete in P2 and 4 issues of ‘Poor/Defect’ anomalies at a depth of approximately 35.6m – 35.7m within P6. Further tomography assessment of P6 at 35.7m concluded that only 40% of the cross-sectional area of the pile comprised of 40 MPa concrete.
Core drilling of the piles was then recommended. On attempting to drill and core P5 the subcontractor made 4 attempts to reach the bottom of the pile without success using a percussion drill with a 100 mm diameter tungsten carbide head. The helical reinforcement was damaged during these attempts as it was struck by the carbide head. It is assessed the drill head maybe wandering during drilling due to potentially softer section of concrete due to removal and reentry of the tremie tube. P2 was successfully cored, the sample revealed what appears to be a 50mm layer of loose coarse aggregate from the segregation of concrete at the toe between sound concrete and the sandstone rock socket.

Figure 3 – Coring samples from P2. Note the aggregate in Core 3.
The toe of the core was cleaned using air to show the extent of the void. The void was measured at 400 mm at the base of the pile and a photo is shown in Figure 4 from a CCTV recording of the core. The coring holes and toe void were grouted, and subsequent CSL showed some improvement.

Figure 4 – CCTV photo shows the void at the base of P2, slowly filling with ground water.
P1, P2 and P5 were high-strain dynamically tested using a pile driving analyser (PDA) to check the mobilised capacity. The mobilised capacity of P1, P2 & P5 exceeded the required capacity. A guide to structural integrity and performance of the pile is given by considering the energy of the hammer blow delivered to the pile by the 20 tonne drop weight (Figure 5). The piles subsequent responding mobilisation capacity and estimated static deflection at mobilised capacity was much less than the allowed movement of 85 mm. The temporary compression of the piles under dynamic loading ranged from 8.1 mm to 9.9 mm with a 1 mm set.

Figure 5 – High-strain dynamic testing hammer on P1.
The pile resistance is subject to input data, primarily including Young’s Modulus and the Damping Constant. Corrected values of Young’s Modulus are correlated with signal matching from CAPWAP (Case Pile Wave Analysis Program) testing which estimates the total bearing capacity of the pile. The CAPWAP results showed the concrete over the length of the socket is a lower modulus than the upper concrete in the pile.
CAPWAP results showed a reduction in the axial stiffness at the base of the pile (i.e. the material at the base of the pile has a stiffness lower than that of “good” concrete). Also a reduction in the pile cross-section at the base of the pile (i.e. there are zones of contaminated or “poor” concrete at the base of the pile).
The Client – Roads and Maritime Services Conclusion
‘Whilst the dynamic analysis provides a pile capacity at this point in time, the uncertainty of the size of the voids and / or quantum of the integrity issues, coupled with the poor integrity section not being fully contained within the sandstone rock socket or the steel pile casing, results in the Principal being unable to determine the extent of any future pile settlement over the design life of the structure.’
Conclusions & Recommendations
The pile should only be considered defective if it does not meet the SLS or ULS requirements. The client has rejected the piles due to the defects with in them despite them still passing the relevant criteria. They have decide to replace P1, P2, P5 & P6, this time using a dry tremie pour, by achieving a seal between the permanent casing and the rock socket.
The reason for failure of concrete in the toe of the rock socket has not been fully concluded. After gaining a better level of technical knowledge on the subject by reading Tomlinson & Woodward, Pile Design and Construction Practise, 5th Ed, Section 3.4.8 discusses the issues related with groundwater in pile boreholes. It mentions, ‘a strong ground water flow can wash away concrete completely’. In cases of strong inflow, ‘the water must be allowed to rise to its normal rest level and topped up to at least 1.0 m above this level to stabilise the pile base.’ It does directly mention this with cased piles but, honeycombing of concrete could certainly be an issue.

Figure 6 – Example of a defective shaft of a bored pile caused by cement being washed out of unset concrete (Tomlinson & Woodward, 1977)
Despite the piles having permanent casings, ground water flow through fissures in the sandstone could have caused the grout to wash out of the concrete, leaving the aggregate in the base of the piles. Grout leakage could have occurred in the tremie pipe during delivery leaving insufficient grout to bond the aggregate. The tremie pipe may have been too far from the toe of pile on concrete delivery causing separation of concrete on delivery.
A dry tremie pour with a high artesian head in the sandstone through fissures could cause the same issues to occur. John Holland have now mitigated risk by the client providing both a methodology and load values required in the piles, with the sub-contractor paying for reworks.
Photo for Comments Section
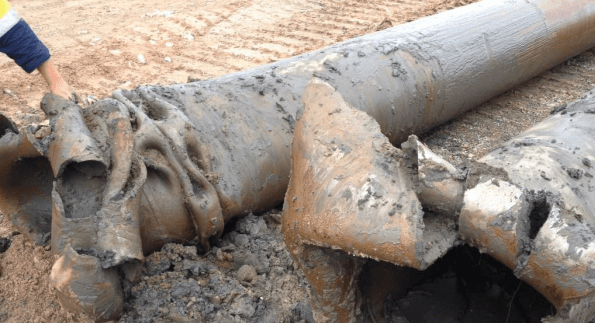
Figure 7 – Plastic deformation of a pile casing driven past refusal
Over-Flighting Causing Potential Failure of a Piling Platform
A cofferdam is required for the construction of an Underpass structure beneath a new Rail Bridge. The current rail line has been slewed 5m to the east of the piling platform to allow for the rail bridge piles and sheets for the cofferdam to be installed. The piling pad is at RL +8.0m, made of 800mm compacted DGB. RL 7.2m to RL -7.5m is dense to medium dense sand. Below RL -7.5m is clay. The GWT fluctuates between RL 1.5 to 3.5m, recharged by rainfall.
Difficult sheet pile driving conditions through coarse grained dense sand have meant pre-augering has been used to loosen the sand prior to driving 18m sheet piles for the Underpass cofferdam. A phenomenon from CFA piling has occurred on the rail bridge piling platform where the predrilling auger has over-rotated and excessive sand has been removed, known as over-flighting. In total, there are 29 augered predilling holes in the platform. the total volume of sand removed is 60m³. Therefore on average 2m³ is removed from each hole. Over-flighting of the auger is increasing the voids ratio within the ground leading to the ground around the auger to settle through vibration as the sheet pile is driven and an increased stress applied. Damian Warren experienced a similar issue at his project near the Thames in London.


Figure 1 – Tension Cracks in the Piling Platform due to Settlement from Over-Flighting
Where a coarse grained loose material overlays a stiff fine grained material issues in augering can occur. The stiff clay layer found at depth requires greater rotation of the auger due to its stiffness. The greater rotations of the auger cause loose sands in the upper horizons to be transported up the flights leading to sands around the auger to fall into the flights creating a void. The voids are being created under the sheet piling machines which may undermine their stability. An augering machine with low torque will require a higher number of rotations to penetrate the stiffer, cohesive clay layers. This issue was not encountered while drilling the CFA piles for a previous task I conducted on the site as the piles for the Canal Bridge did not reach the cohesive clay layer.
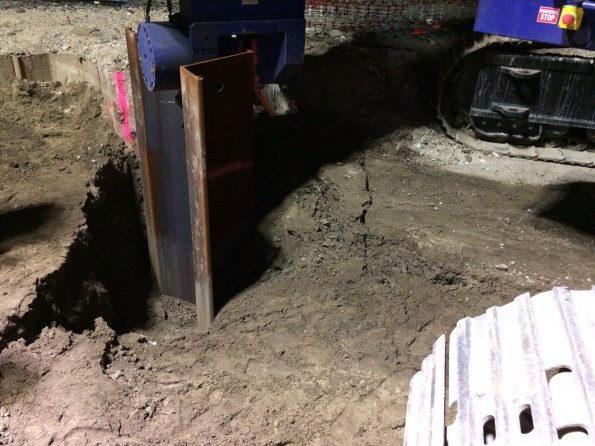
Figure 2 – Settlement of the Ground around the Sheet Pile
The stress history of the soil has been changed by the predrilling. The soil is exhibiting large volume changes after predrilling and during sheet piling suggesting it now has low stiffness compared to the surrounding strata. The stiffness of a soil is very difficult to assess. The differential settlement for across the pad could become an issue for the rigs stability and potentially effect the rail line.
The water table around the piling platform is recharge via infiltration of rain water. Heavy rain over the past few days will have caused the ground water table to rise. A high ground water table exacerbates over-fighting as the soil has increased fluidity in the weak submerged soil particles allowing it flow easier.
The predrilling is being conducted as if it were a secant piled wall, with overlapping bores. The cumulative effect of the close spacing of drilling will increase the settlement issue.
Recommendations
To rectify the issue, geogrid or cement stabilised sand could have been used to reduce excessive ground movement.
Steel plates have already been utilised to support the 72T piling rigs during driving due to settlement issues on the piling platform.
Drill rig selections should be accessed in further piling works to ensure a drilling rig is selected with sufficent torque and crowd combinations that are compatible with auger rotation and penetration into the ground.
Verification
After inspecting the piling platform myself, I wrote a report to the John Holland SPE on my findings. Subsequently a geotechnical engineer came out an observed the piling platform and concluded that the platform still met the design requirements so no further works are required. A rail inspector has also checked the alignment of the railway line, with no issues found.
Are there further issues which should be considered or is this issue normal on site?
Thoughts on Quality Assurance
Introduction. From my time on phase 2 I have been heavily involved with quality management and, for the sake of discussion, I thought I’d articulate what I’ve learnt. If anybody in the UK or Aus has been similarly involved in QA or would like to provide additional comments on the alternative perspective, I welcome your thoughts and insights.
Quality Assurance is an interesting and broad topic that:
- forms an integral element of USACE’s role as the client’s representative
- comprised a large majority of my day-to-day activity on phase 2, and
- provided good links into the full breadth of engineering activities from project scheduling, contract management, finance, safety, and technical engineering.
The following paragraphs highlight what I believe to be the key elements of QA from my experience to date, pointers on how to ensure it is covered effectively along with a little info on some issues faced on the JOC project. It is not exhaustive and it began to run the risk of progressing into a full-blown essay – Please feel free to ask for more detail on anything you’d like to know more on.
The Preconstruction Conference. Prior to any construction work, these are held in order to ensure mutual understanding i.e between the client and principle contractor. It is apparent that these are often not done properly with patchy attendance from the quality team. The Contractor quality control (CQC) team is fundamental to ensuring the quality of the finished product so the whole CQC chain of command should be included in these meetings. This ensures a proper understanding of the client’s priorities and design intent are passed on to the QC and QA team members with less opportunity for misunderstanding or interpretation.
The Quality Assurance Plan. This are an excellent management tool but is often neglected or not even written but, without them, co-ordination of QA objectives can be extremely difficult. This must be considered a high priority for anybody involved in the management of a large project and is particularly pertinent to our future role as PQEs. East Campus is fortunate to be in possession of a detailed QA plan and its content can be broken down into the following sections:
- Govt staffing requirements and the functions of each QA team member
- Govt trg requirements and qualification levels required for each team member
- Govt pre-award activities
- DFOW list (see below)
- Govt monitoring and testing activities (responsibilities, frequency, detail, standards referenced)
QA reports. Similar to a site diary for supervision of site work, quality management requires accurate daily reports. These often seem tedious and unnecessary at the time of writing but invaluable several months later when a claim is received from the Contractor. As a rule, the daily reports should include details of:
- Meetings attended and instructions given
- Results of tests, deficiencies observed in work and actions taken.
- Developments that may lead to a change order or claim against the government (bad weather, RFIs received or design conflicts/deficiencies identified).
- Progress of work (incl manpower and equipment on site), causes and extent of delays.
- Safety Issues.
Deficiency tracking system. Elements of work which the QA team believe fail to meet the requirements of the contract must be recorded in a database for monitoring. This allows the client to know how much work was completed right first time and also prevents deficient work being covered up and forgotten. This is particularly important as, from my experience, contractors prefer to separate their production and CQC with deficient work often being monitored and corrected by a separate ‘Tiger team’ once work has moved forward. The deficiency list must be updated regularly with status, and dates of corrective action. From experience, I can confirm that this action is always best performed before the sub-contractor leaves the site!
Defined Features of Work (DFOWs). Any item of work with a separate and distinct method of applied QC including inspection, testing and reporting can be considered a DFOW. The principal is close to that of producing a product or work breakdown (PBS or WBS) with the addition of each DFOW item containing detailed lists of paperwork required from the contractor, products to be used, preparation and execution requirements, and testing & inspection regime for acceptance. For me, I often found myself relying on this paperwork more than the drawings to understand and QA the work I was responsible for.
Control phases. USACE conceptualize quality control into a three phase process consisting of a preparatory phase, initial phase and, finally, an acceptance phase. More often than not, quality issues on site can be attributed to a failure in the preparatory phase, making it the most important from a QA perspective. This may run counter-intuitively to anybody that views the QA team as primarily focused on the acceptance process. Briefly, the ‘prep phase’ should answer the following questions:
- Are materials on hand, and if not, when and how will they be arriving & stored?
- Are delivered materials as per the contract requirements and stored properly?
- What exactly do the contract specifications and submitted paperwork require to happen?
- What is the procedure for accomplishing the work? i.e sub contractor’s method of works, including health and safety assessment and sources of potential conflict etc…
- Are we all happy? This is a final chance for parties to air concerns with the plan or nature of work. The cost and time implications of discussing these concerns later will often be much higher so is quite important.
As built drawings. This is an important product for the end-user. The team here in East Campus hopes for updated drawings every month but the contract only requires them upon final completion. This can frustrate attempts to review work and identify conflicts before they become issues. It is recommended that, if possible, submission of these is specific and agreed in writing with appropriate penalties for failing to comply. To be effective, a review procedure must be in place.
Quality Assurance Testing. The general rule followed by USACE is that QA should test the work at approximately 5% of the Contractor’s QC frequency. This commitment to, basically, duplicate work the client has already paid the Contractor to do should be understood and appreciated in terms of the workload generated for the QA team as well as the value gained by the client in terms of verifying the Contractor’s efforts. I have, at times, felt that the Contractor has taken advantage of this overlap of responsibilities, making the following point even more relevant.
Quality Control Requirements. The Contractor must be required to provide the CQC function in terms of the roles performed and the qualifications of those that perform them. My greatest issues with the CQC team on the JOC project have been:
- QC being performed by unqualified personnel (an electrical engineer inspecting the placement of reinforcement for structural concrete)
- Double-hatting manpower (fine until you have a full day of concrete placement and your QC rep has to supervise it “remotely” as they’re elsewhere on site inspecting other features of work – ensure the contract specifies different roles as “not to be performed by an individual performing other role” if possible)
- 3rd Party testing inspectors being considered sufficient (Relying on the concrete testing technician to QC a concrete placement – the contractor is now demolishing $44,000 of concrete pavement because of this. Unsurprisingly, the technician was only concerned with slump testing etc… and not the location of expansion joints or texture applied during finishing).
Baseline schedule. Is it submitted by the contractor and accepted by the relevant engineer / manager? Is it resource loaded, with updates (complete or just status) submitted monthly? A function of QA is to identify potential delays and to do this, comparison must be made between the schedule and actual progress on site. Identifying potential delays or poor progress early can help prompt the contractor into recovering time before it becomes an issue.
Summary. Ultimately, a much longer post than I had originally intended. Hopefully, it gives you a flavor of the nature of QA work and can function as a starting block for anybody responsible for establishing the quality management process on future projects.
Smoke without fire
A relatively long post on Fire Stopping, not fashionable but an issue that can cost project success if ignored.
I am currently, among other things, managing the fire stopping design and installation for the Skanska-Astra Zeneca site in Cambridge. Like most large scale non domestic construction at the moment, the project is unable to conform to the approved documents (Approved Doc B (part 2: buildings other than dwellings). This is in large part due to the approved documents not keeping up with the requirements of the industry, electrical installations are becoming more complex and IBMS systems are adding huge volumes of cabling over traditional sites.
In order to gain building control approval, my project is being delivered via a Fire Engineered Solution. We are governed therefore by a Fire Strategy that has been designed by ARUP Fire, in consultation with the client and building control.
We have engaged an independent fire consultant (International Fire Consultants Ltd) to approve our designs, which are then signed off by building control. Where we are unable to meet the required standards, we attempt to work within previous fire tests, or adapt designs to meet pre certified layouts or equipment. Where an issue cannot be resolved through changing geometry or material, we can apply to use an Expert Assessment, a technical assessment made by either a product manufacturer or the Fire Consultant and based on relevant test data from which an assessment for a different layout or usage can be made. When we cannot convince the Fire Consultant that a solution is adequate however, the last resort is to conduct an independent test to prove that a suggested layout and equipment can be used safely.
Due to the cost of fire testing (around £15,000 per test sample for a 3mx3m wall section) and more importantly the delay (earliest available tests are currently January-March due to increased testing following Grenfell) various Skanska sites are sharing test data to gain consultants approval.
This week, due to the absence of the package manager on a nearby site, I went to Warrington to witness a test commissioned by Skanska to test an array of cable and containment combinations.
The tests are relatively simple, you build a wall to the same construction as you intend to use on site in a 3mx3m frame, install all the services you require, and fire stop the wall with your designed solution, generally a mixture of Ablative coated Batt and Intumescent Mastic. You then hand the wall over to the independent testing company, they apply the face of the wall to a furnace, add thermocouples and set fire to it.
This test was to gain a 60min fire rating for both insulation and integrity. Insulation being defined as not exceeding an increase of 180K in temperature on the non-exposed side and integrity meaning that the construction of the wall, services and fire stopping does not fail during the test period.
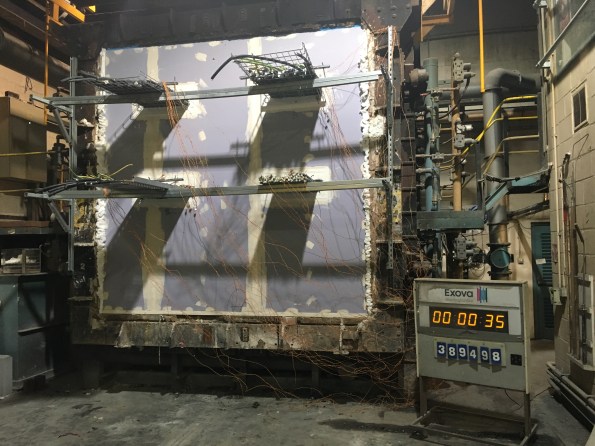 Figure 1. Test sample at start of test, trailing wires are thermocouples
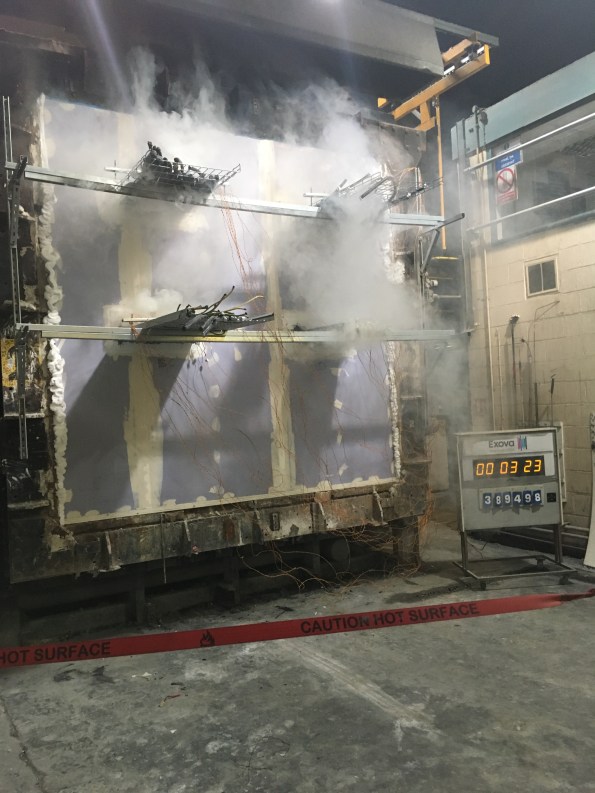 Figure 2, Wall after only 3 mins of exposure. Large amount of smoke on non-exposed side.
The large amount of smoke experienced early in the test was surprising, however this was due largely to the amount of time it takes for an intumescent material to react to the heat and the amount of space between cables that cannot be reached with mastic.
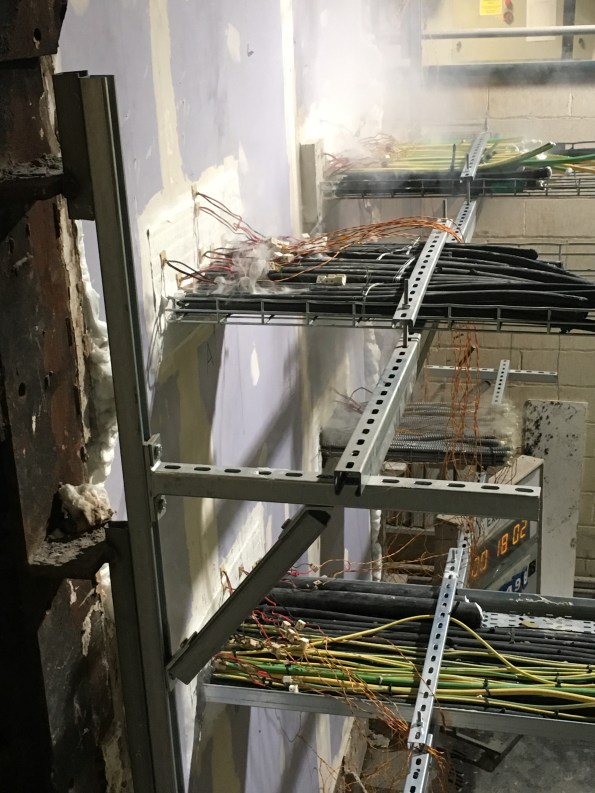 Figure 3. 18 mins Smoke penetration almost stopped.
On the lower two penetrations a black mastic was used. Black mastic uses graphite which offers increased expansion and is often used in fire sleeves to crush plastic pipes (but it much more expensive than traditional fire stopping mastic). It can be seen that the smoke ingress through the two penetrations treated with black mastic has almost entirely ceased by 18 mins into the test. The two penetrations treated with a traditional microporous carbonaceous foam continued to leak smoke throughout the test.
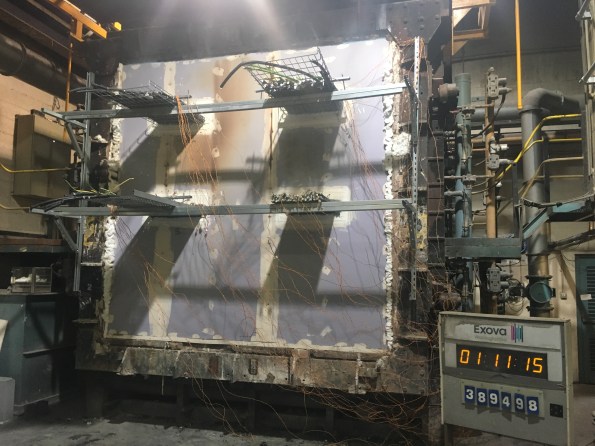 Figure 4. Wall at end of test.
By the time the test was completed, all of the samples had maintained integrity, however the bottom right sample had failed insulation after only 24 mins. This was a modular wiring system and the metal outer sheaths conducted the heat very quickly. It can also be seen that the wall construction its self was close to failing by completion, and in fact as soon as the furnace was stopped, the change in pressure led to fail along the seams.
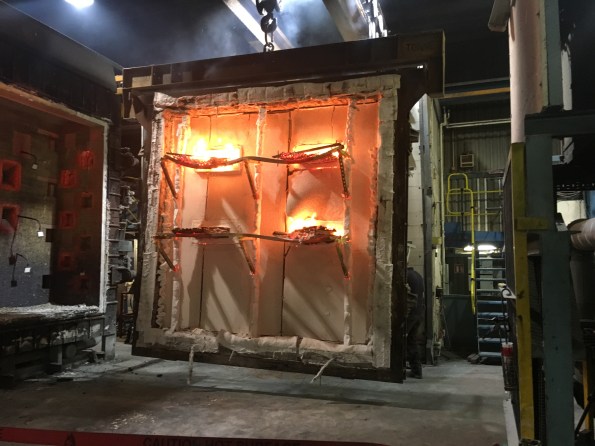 Figure 5. Exposed face immediately after test stopped.
Reverse of wall after removal from furnace. Note the amount of deflection in the unistrut system. It often seems like the regulations or guidance lead us to over engineer solutions, however after only 60mins the support system had almost catastrophically failed, as soon as service supports fail in a fire situation, the weight of the unsupported services crushes the fire stop material and possibly the wall construction its self, leading to rapid fire spread.
A relatively long post about burning down a wall, but good experience in escalation of solutions to overcome design or regulatory issues. The cost of gaining a bespoke solution is relatively low for a large project, however the time taken to complete a test (from booking to report issued) is often too long for a project, especially is the issue is identified late. This solution is generally a last resort or when a costly risk has been identified early and the completion of a test can stop the risk becoming realised.
You sunk my barge……
I thought you may like the pictures. As many of you know, at the Northern Line Extension we use barges on the Thames in order to remove our muck, fed by a conveyor system from our site.
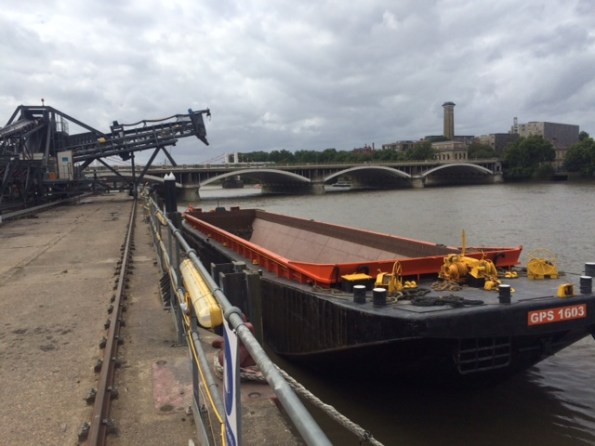
Fig 1. Empty Barge
The capacity is between 1200 and 1600t depending on which barge is being used, measured by the draught of the barge. The draught is measured prior to loading, using draught marks, and monitored during loading so that the weight in the barge is known; as a back up the weight of muck is measured as it goes over the conveyor belt.
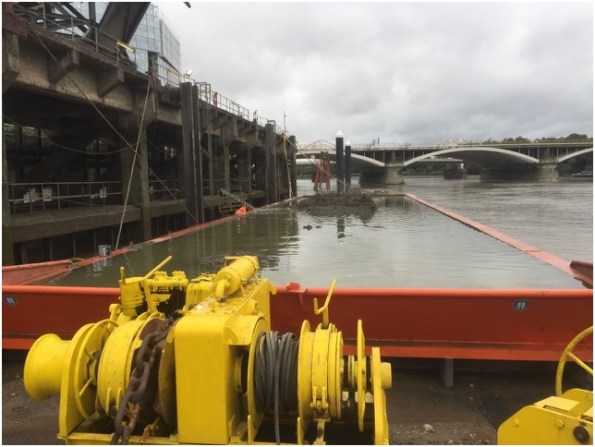
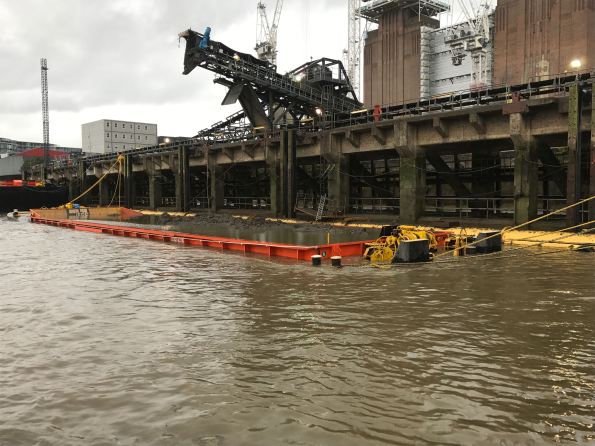
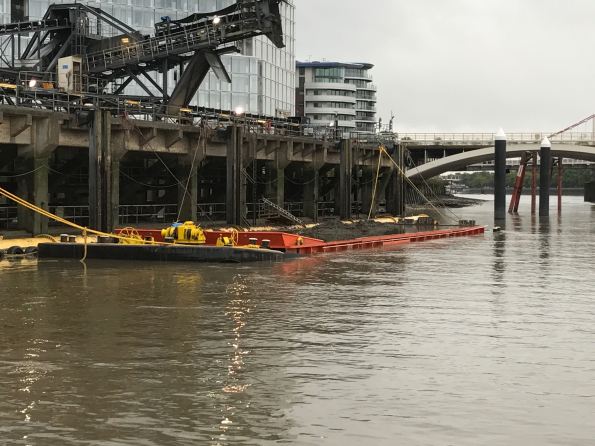
Fig 2 Sunk Barge
So what actually happened? The Lighterman who is responsible for loading the barges was carefully watching as the barge was being loaded, the draught was ok. Despite the ever increasing reading from the conveyor belt read out, the draught was still ok. Once the conveyor belt reading was in excess of 1900t the conveyor belt was stopped, but the draught was still ok……. Turns out the barge was just sat on the river bed so despite what the photos look like, technically the barge did not sink, it just failed to float once the tide came in.
Walter Reed Army Institute of Research (WRAIR)
Hello all. Just a quick update on my mechanical adventures in America. My sites at the United States Army Medical Research Institute of Infectious Diseases (USAMRIID) are drawing to a close so I was asked to head down to military Medical Research camp known as Forest Glen to fill in a gap created by their resident Mechanical Engineer retiring. Forest Glen is home to the Walter Reed Army Institute of Research (WRAIR) and is located just north of Washington D.C. The distance from home is actually smaller but with D.C. traffic (rumor has it that it is intentionally bad so as to act as a deterrence to invading forces!?!) my commute time has increased.
WRAIR is the largest biomedical research facility administered by the U.S. Department of Defense (DoD). The task at WRAIR is to repair ten air handling units (AHU), three of which are located in the basement with the other seven located on the roof in three separate “penthouses”(see image 1). These AHUs supply a variety of rooms within WRAIR including everything from animal laboratories, patient observation areas that monitor brain injury, and sleep management, photo development rooms as well as offices.

Image 1: Three Penthouses located on roof
Due to the fact that constant clean air supply is key to the operation of these rooms disruption to the AHUs has to be kept to a minimum. “Repair” is a bit of a misnomer as it is more of a full renovation of the inside of the AHUs while keeping the outside shell. For this to work correctly temporary AHUs (see image 2) are located beside each AHU prior to the beginning or work. The temporary units are then connected to the system as close to the existing AHU as possible.
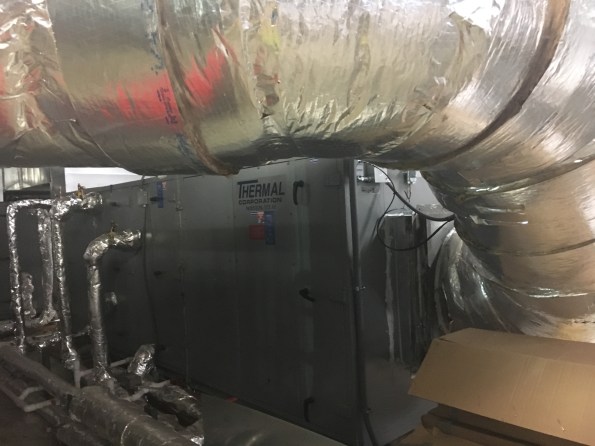
Image 2: Temporary AHU
The existing AHU is powered down at the last possible moment with the temporary AHU immediately kicking in so as to avoid disruption to the labs downstairs. To further avoid disruption this always takes place at around 0500 when no humans are in the building and the ambient temperature is naturally low.
The repair of the existing AHUs consists of effectively gutting the interior (see image 3), installing a divide in the middle so as to allow maintenance of the AHU in future without the requirement for temporary units and then replacing the filters, the copper cooling elements (see image 4), humidifier, fans and mixing chamber.
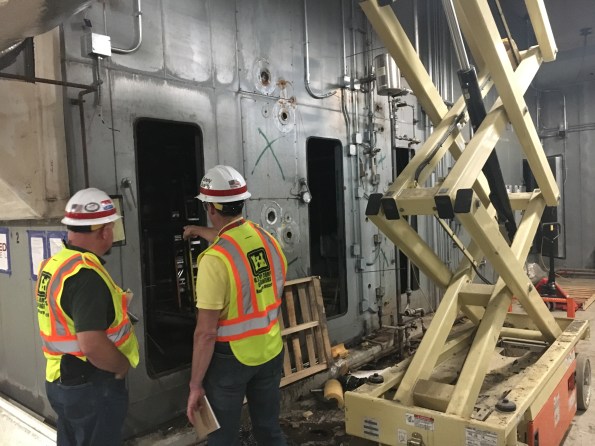
Image 3: Gutted AHU
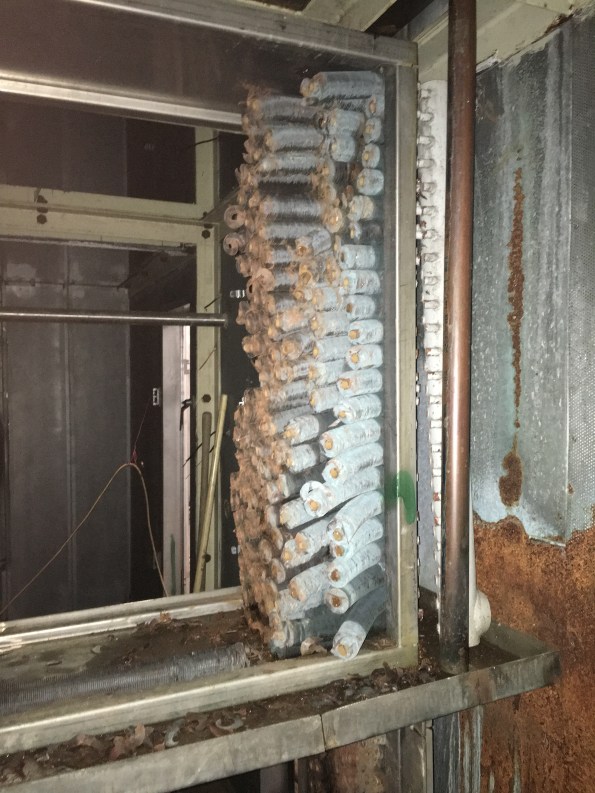
Image 4: Removed cooling coils
Currently we are on the 3rd AHU of 10 with roughly 2 months allocated to each unit. The project is currently ahead of schedule but due to the limited times the AHUs can be shut off or tested once completed any delay could easily devour the existing lead.
Cofferdam Dewatering Assistance Required
Civil friends, I would appreciate your input on the following dewatering issue I am currently faced with. This to ensure I am on the right path before I look into a suitable well point dewatering system, effects of drawdown, settlement and dealing with contaminates in the groundwater etc.
Design
Sheet piles have been installed as temporary works to a set depth to form a single skinned cofferdam. A rail bridge will be subsequently constructed over the sheet piles footprint, prior to the cofferdams excavation to create an underpass. To date the sheet piles have been installed but there is no set solution to dewater during excavation.
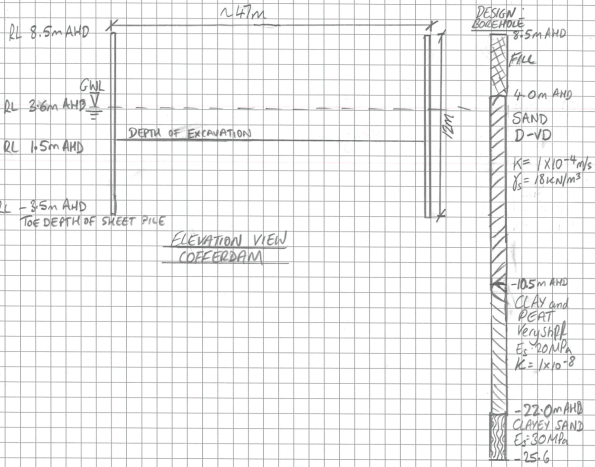
The rail bridge is at 8.5 mAHD, the sheet piles have been driven to a depth of -3.5 mAHD (12m long). To establish acceptable dry conditions for work, it has been proposed to dewater to 1.5 mAHD (the finished underpass road level is above the water table).

Conceptual Model of Groundwater Flow
There are two main groundwater systems beneath the site, a deeper confined groundwater system separated by the fractured Hawkesbury Sandstone and a shallow, unconfined / semi confined system within the Botany Sands. I have taken the groundwater level as RL 3.6 mAHD based on advice from Douglas Partners. Recharge of the Botany Sands Aquifer occurs through direct rainfall infiltration in the highly permeable sands as well as high and low tide. I have taken the average permeability across the Botany Sands as 1 x 10⁻⁴ m/s as per Douglas and Partners advice.
Estimation of Total Flowrate
I have used analytical methods to estimate the flow into the cofferdam which has produced a rather high daily flow rates of 1.9Ml per day.
Below is a draft flownet for the problem.

It has been deemed unfeasible to drive sheet piles to the clayey sand layer which may or may not be there or provide a cutoff.
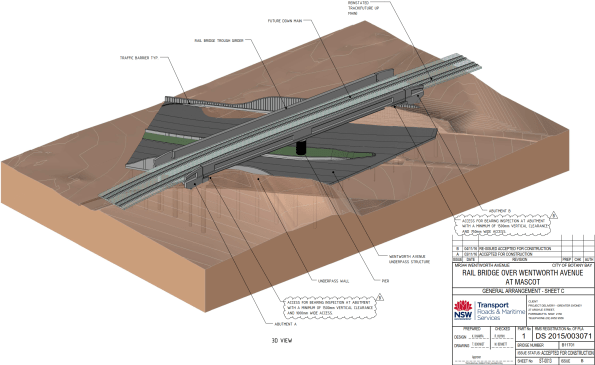
Completed Rail Bridge and Underpass structure
Many thanks.
AHD – Australian Height Datum
The Rising Factory
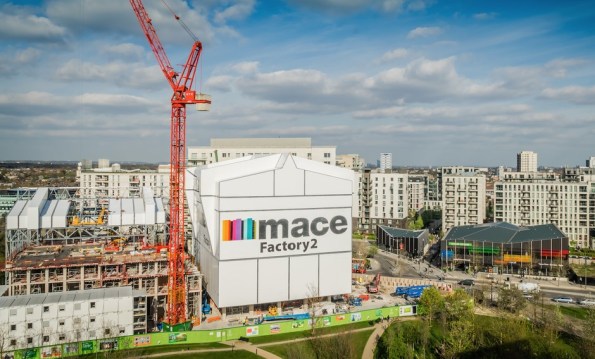
Figure 1. East Village, Stratford.
Summary
As part of the handover between Skanska and Mace, all Battersea phase 2 staff are getting various presentations from Mace to tempt us to join them. Yesterday we had a presentation which featured a different Mace project, East Village in London, which is being constructed in a really innovative way, and I thought I would share. I must stress that I have not worked on, visited (I am trying to arrange this) or even seen this site, and that my knowledge is restricted to what is contained in here. They are using jump forming of sorts, but instead of just producing a concrete core, they are raising the ‘rising factory’ to reveal a completed floor of the building. Interestingly, all lifting is done via gantry cranes inside the rising factory, utilising the riser shafts within the building. This negates the need for tower cranes (NB the tower crane in Figure 1 is for the surrounding construction) and eliminates down time due to high wind. The weatherproof factory environment also allows for safer construction year round.
Background
The jump form and slip form systems are well established, but what emerges is the raw core of a building with all the remaining elements still to be constructed, with all the associated programme disadvantages. The ‘rising factory’ is a 10 storey high enclosure inside which the construction of a complete multi-storey building takes place over 5 construction levels. What emerges as the factory is jacked up on its weekly cycle is a level of newly constructed building which from the outside is complete and just requires finishes to be applied internally. Cranes (including vehicle container offloading), storage and welfare facilities needed for the construction activities are all within the enclosure and varying types of activities happen at each level from construction of the structural columns and slabs at the top to completion and sealing of the cladding at the lowest level. A jacking system is permanently attached to the factory columns and the jacks engage with the support brackets when the factory makes its weekly lift. The factory facilitates the construction of a 30-storey building with a cycle of a week per floor, giving large programme and site health and safety benefits. These benefits are significant for all parties.
Operation
In 2016 Dorman Long Technology (DLT) were awarded the contract by Mace to supply two pinned climbing jack systems for the construction of twin residential towers at their East Village Development. The project aims to construct two high-rise residential towers using pre-cast concrete construction. The ‘rising factory’ concept is used to create a waterproof factory environment for construction and fit out of each floor. The scheme uses a temporary steel rising factory building erected over the top of each residential tower during construction, which contains two 15t gantry cranes. After each floor has been constructed the temporary steel rising factory is lifted by 3.3m by the 4 x DL-CP250 pinned climbing jacks which remain static, but lifts the climbing bar connected to the rising factory, allowing the next floor to be built.
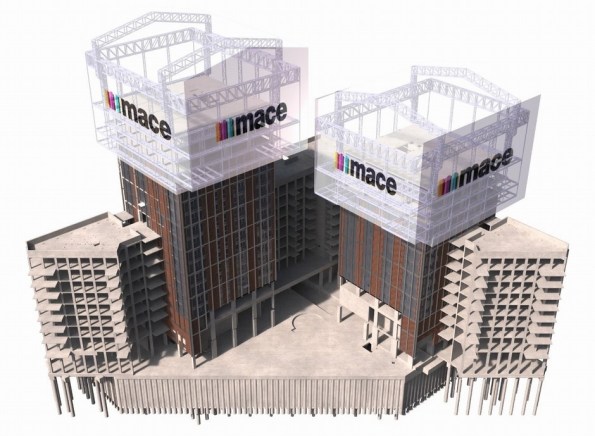
Figure 2. Image from 4D modelling.
The first jump of the rising factory was completed successfully in Feb 2017. During this jump the factory was raised 6.6m – twice the intended standard jump distance of 3.3m. This was to allow completion of assembly & cladding of the factory structure and construction of the next two floors of the 30 storey tower. Figure 3 and Figure 4 show the factory before and after the jump. The factory, which in this partial completed state weighed 565t, was lifted using four 250t DL-CP250 pinned climbing jacks controlled by DL-P40 computer control system, as shown in Figure 5.

Figure 3. Tower before jump.

Figure 4. Tower after jump.
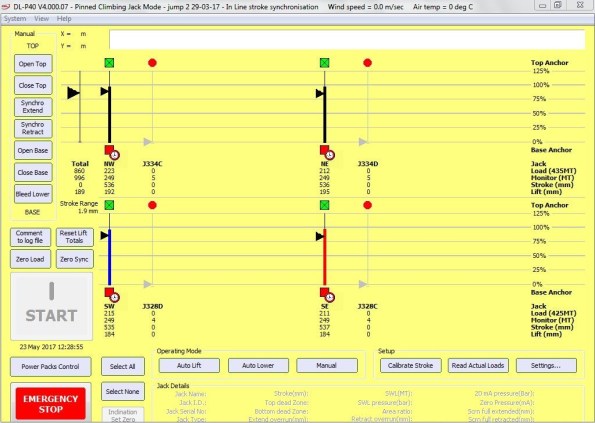
Figure 5. DL-P40 computer control system during jump
During construction of towers, the weight of the rising factory is supported by four hydraulically operated pins (Figure 7) which connect it to the high-rise building via four jump brackets, one fitted to each corner column of the building. All vertical and horizontal loads from the rising factory are transferred to the building via these pins. During factory operation the pinned climbing jacks (Figure 6) and climbing bars are not subjected to any imposed loads. During the jacking of the factory the pins are hydraulically withdrawn and the pinned climbing jacks lift the climbing bars which are fitted to the rising factory. The pinned climbing jacks are each mounted on top of a jump bracket via a pair of link plates.

Figure 6. DL-CP250 Pinned Climbing Jack.

Figure 7. Hydraulically operated pin.
Conclusions
This method appears to offer huge benefits to construction, but like many innovative techniques, it must be chosen early in the design stage. The footprint of the building must not be too big, and the risers must be sufficiently large and appropriately placed to allow all of the required materials to be lifted through them. Although this case study uses pre-cast concrete elements (saving further time) I cannot see why it could not be adapted to contain a concrete pump and use cast-in-situ construction if desired. The benefits are obvious, and although there are numerous projects where this construction method will not be suitable, I expect to see an increase in the use of rising factories.
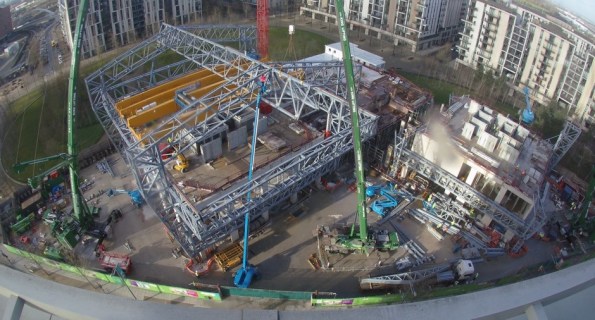
Figure 8. The rising factory from above.
